- ETH price started a steady rise above the $158 and $160 resistance levels against the US Dollar.
- The price traded above the $165 level and recently corrected lower below $165.
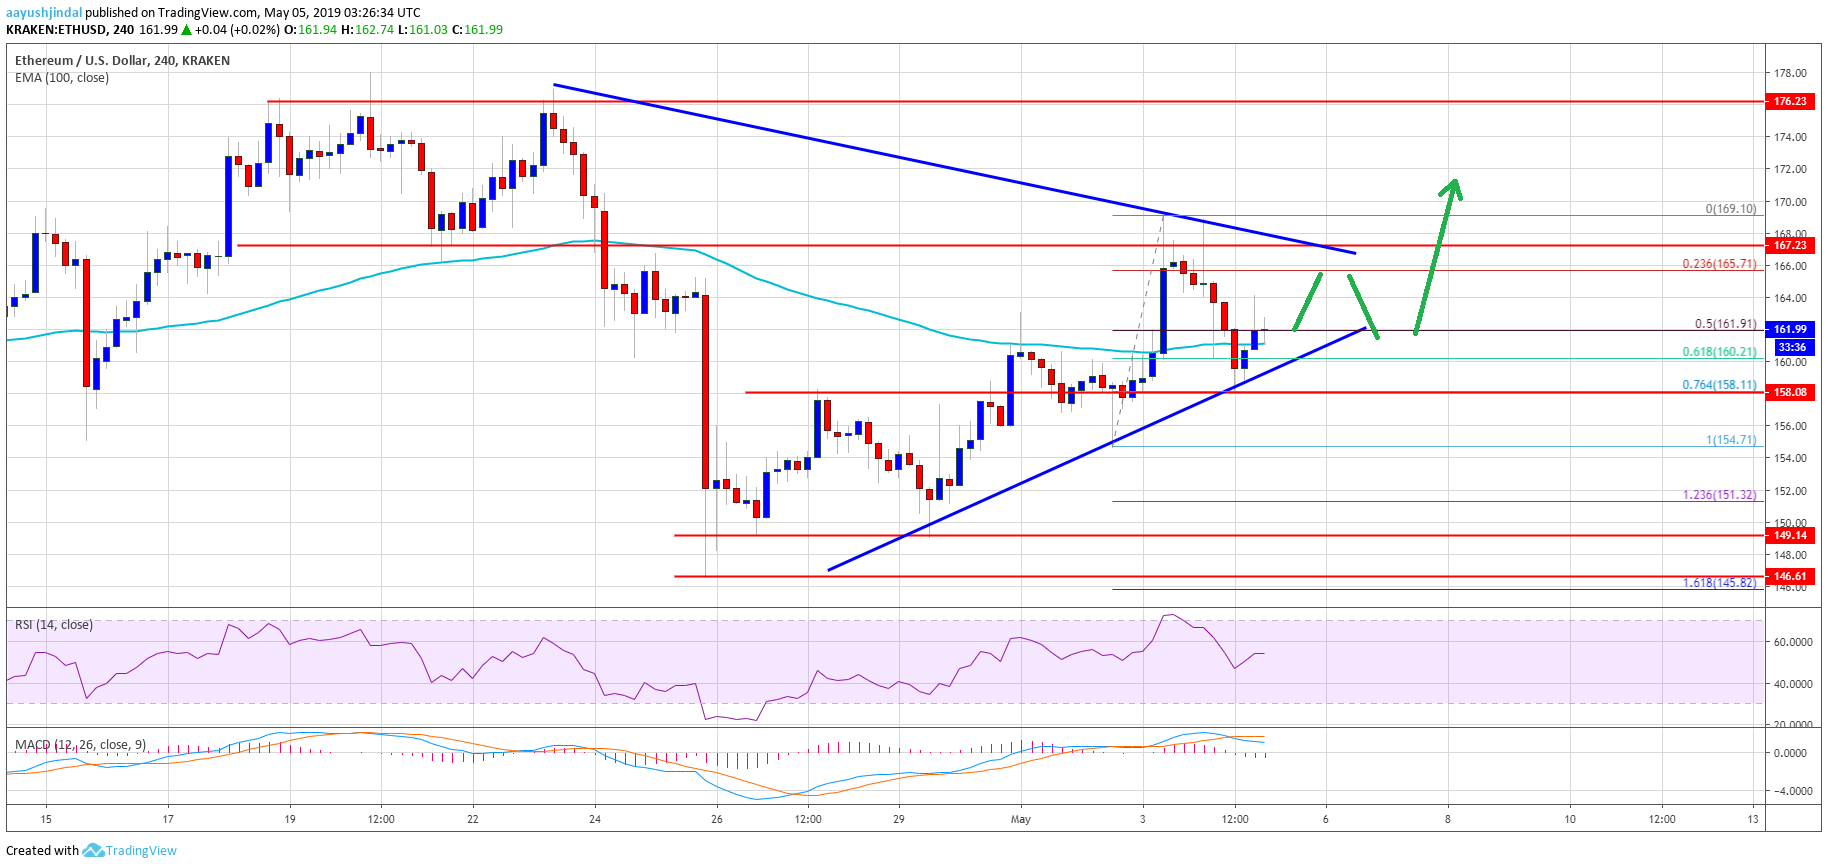
- There is a major contracting triangle in place with resistance near $167 on the 4-hours chart of ETH/USD (data feed via Kraken).
- The pair is likely to climb higher in the near term towards the $170 or even $180 level.
Ethereum price remains in a decent uptrend versus the US Dollar, but in downtrend against bitcoin. ETH is struggling to follow BTC’s rise, but it may soon climb higher.
Ethereum Price Weekly Analysis
This past week, Ethereum price formed a decent support base above the $150 level against the US Dollar. The ETH/USD pair started an upward move after bitcoin price started a strong rise above $5,500. There was a strong wave above the $155 and $156 resistance levels. The price even broke the $160 level and settled above the 100 simple moving average (4-hours). The bulls pushed the price towards the $170 level, where sellers emerged.
As a result, there was a downside correction below the $166 and $165 levels. The 50% Fib retracement level of the last wave from the $154 swing low to $169 swing high was breached. Ether price tested the $158-160 support area, where the bulls protected more losses. It seems like the 76.4% Fib retracement level of the last wave from the $154 swing low to $169 swing high acted as a support. More importantly, the price is still above $160 and the 100 simple moving average (4-hours).
There is also a major contracting triangle in place with resistance near $167 on the 4-hours chart of ETH/USD. If there is an upside break above the $165 and $166 levels, the price is likely to grind higher towards the $169 and $170 levels. Above the $170 swing high, the price is likely to rally towards the $180 level. On the other hand, if there is a downside break below the $158 support, the price could start another drop to $150.

The above chart indicates that Ethereum is trading above a few important supports near $158. Besides, as long as the price is above the 100 SMA, there are high chances of an upside break above $170 and $172. The main target for the bulls could be $180, where sellers are likely to defend a run towards the $200 level.
Technical Indicators
4 hours MACD – The MACD for ETH/USD is currently slowly moving in the bearish zone.
4 hours RSI – The RSI for ETH/USD recently moved back above the 50 level, with a positive angle.
Major Support Level – $158
Major Resistance Level – $166
The post Ethereum (ETH) Price Eyes Larger Upward Move: Can Bulls Make It? appeared first on NewsBTC.
Source: https://www.newsbtc.com/2019/05/05/ethereum-eth-price-eyes-larger-upward-move-can-bulls-make-it/
