
The Aptos price analysis reveals a positive momentum, and the APT/USD pair is up 2.57% in the last 24 hours, trading at $8.18. The bullish sentiment for Aptos (APT) has been strong over the past few days as bulls remain in control of the market. The price surged from a low of $7.38 today and hit a high of $8.19 before correcting lower.
The market capitalization for Aptos is also on the rise, currently standing at $1.57 billion, with an increase of 2.19 percent in the last 24 hours; however, the 24-hour traded volume for APT/USD is down to $63.7 million, indicating a mild buying pressure.
Aptos price analysis 1-day price chart: APT continues recovering after a short correction
The one-day Aptos price analysis shows that the price has increased further during the last 24 hours after taking a small dip at the start of the trading session. However, the trends have been in favor of bulls for the past few days, along with today’s trend. The price level after the recent bullish progress has increased to the $8.18 level. The moving average (MA) is trading above the price level at $8.84 in the one-day price chart.
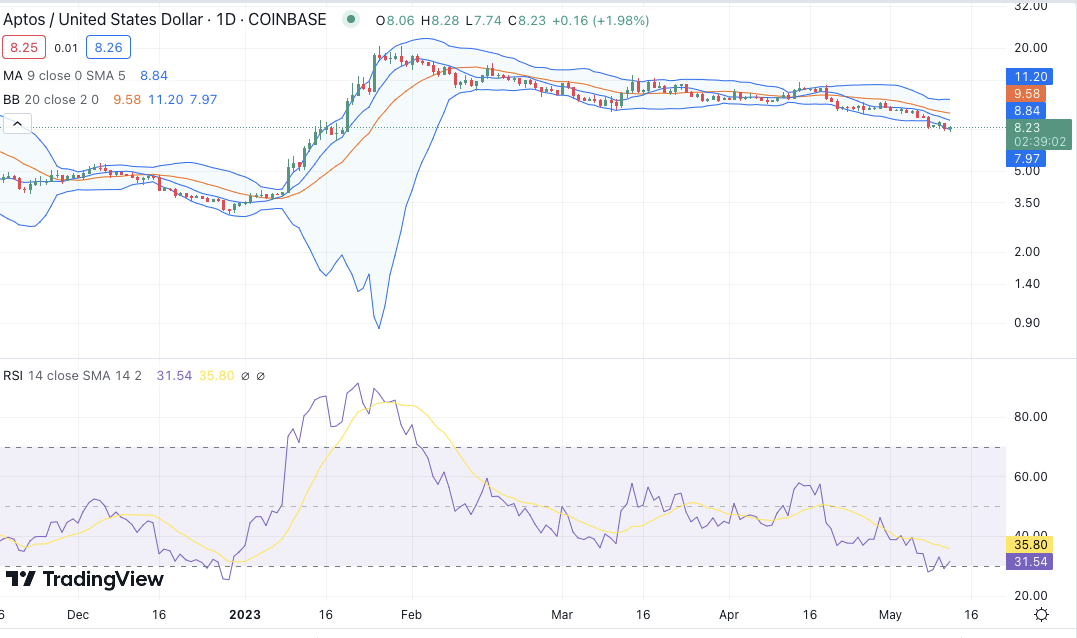
The volatility has been increasing; hence it can be expected that a further uptrend might follow. The Bollinger Bands Indicator shows the following readings for the day; the upper value is $11.20, and the lower value is $7.97, indicating that the price is likely to remain in the range of $7.21 and $8.25 for some time. The MACD indicator is trading in the bullish zone, which suggests that the price will continue to move up as long as there is strong buying pressure from traders. The Relative Strength Index (RSI) has been rising steadily and is currently trading at 31.54, indicating that the coin is neutral in the market.
Aptos price analysis: Recent developments and further technical indications
The 4-hour Aptos price analysis suggests a dip in price levels was observed in the first four hours of the trading session when the price decreased to the $7.18 level as a correction took place at the end of the previous trading session, which continued into the first four hours of today’s trading session. But bulls returned and took control; as the coin started to get the positive market sentiment, the price levels turned green and are still on the increasing side. After the recovery made during the last few hours, the price has reached $8.18 and seems to be increasing further over the coming hours.

The moving average indicator is showing a value of $8.02, a mark below the price level on the 4-hour chart, which suggests that the bullish momentum is expected to continue over the next few hours. The Bollinger Bands Indicator has a lower value of $7.77 and an upper value of $8.71, suggesting that the price will stay in this range until further volatility occurs. The MACD indicator has been trading in the bullish zone for some time now and is showing a crossing of the signal line, indicating a further price surge. The Relative Strength Index (RSI) has been trading above the 46.20 mark for some time, which suggests that the coin is neutral in the market.
Aptos price analysis conclusion
Overall, Aptos price analysis is looking positive and should remain so in the coming days. There is still some volatility in the market, and trading decisions should be taken with caution. However, given the current momentum, it looks like there could be further price appreciation in the near future. The buying pressure should remain strong, and the price could continue to reach new highs. However, if bearish pressure enters the market, a short-term correction may take place.