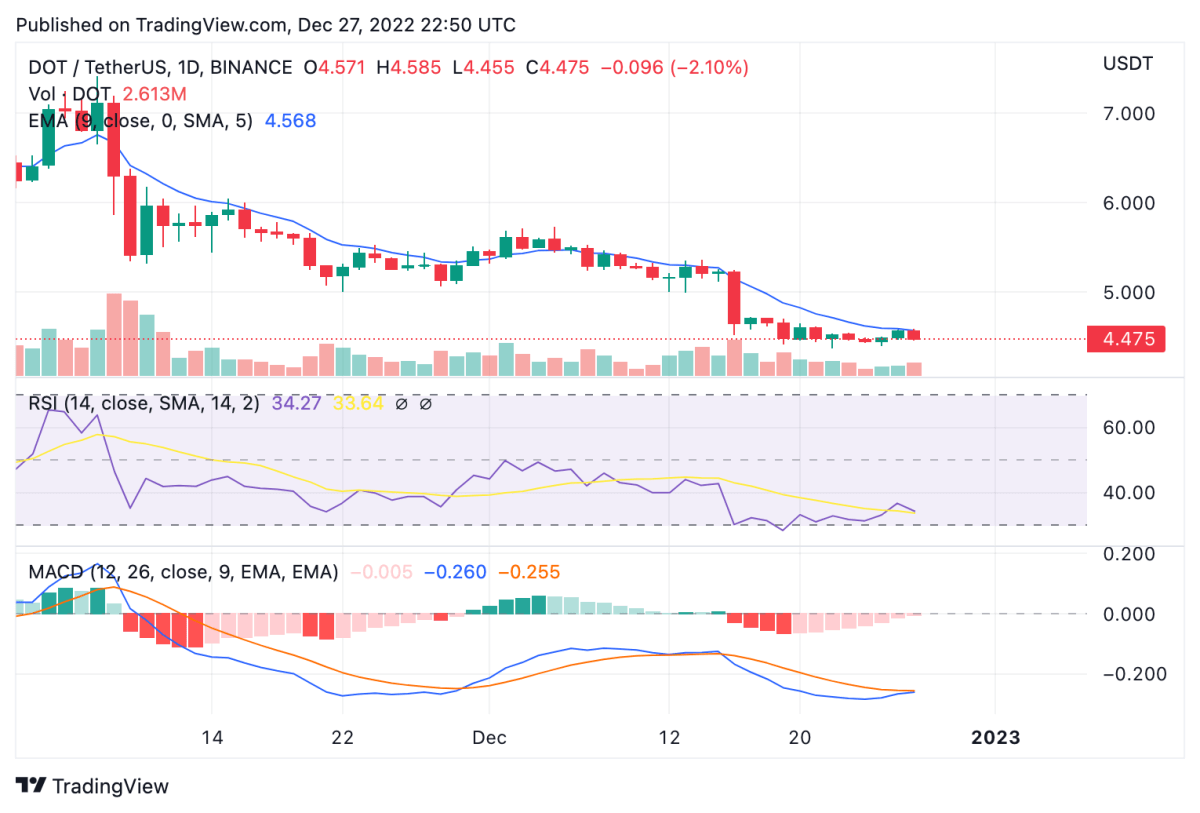
Polkadot price analysis shows that price could be set for a breakout in the new year, as it settles above the $4.370 support zone. After declining down to $4.551 on December 16, DOT price has moved above the perpetual support mark at $4.37, even though price declined more than 1 percent over the past 24 hours. On the daily chart, DOT price is in downtrend currently, with bears dominating the market and price forming lower low swings. Similar patterns were seen in August, with price eventually breaking out to hit a bullish high of $9.58 after lowering down to $6.52. The current bearish run could hold a similar breakout for DOT.
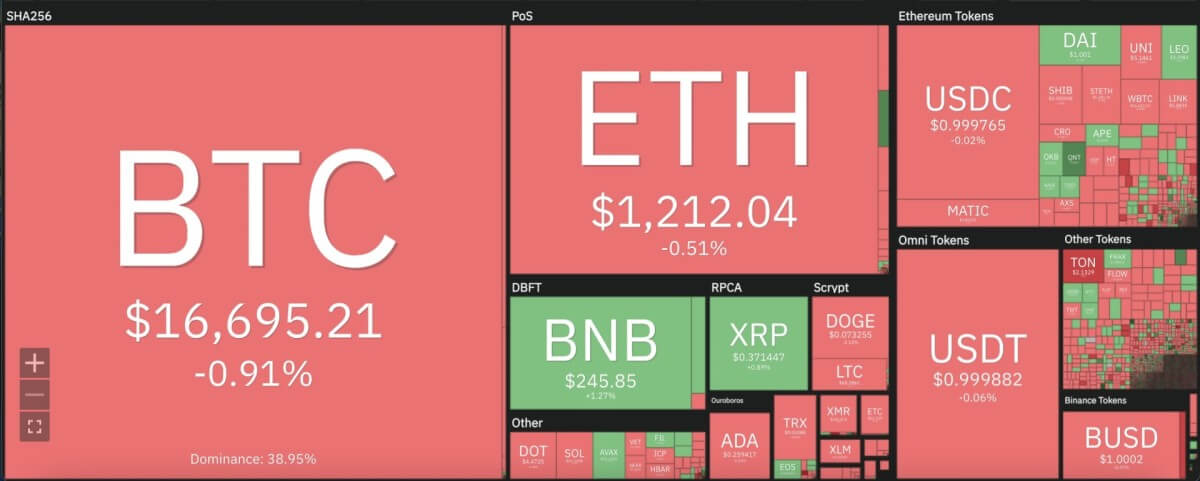
The larger cryptocurrency market remained stagnant near yesterday’s price points, as Bitcoin remained in pursuit of the $17,000 mark, and Ethereum moved just above $1,200. Among leading Altcoins, Ripple made a minor increment to move up to $0.37, whereas Cardano dropped 2 percent to move down to $0.259. Meanwhile, Dogecoin also shed 2 percent in price to move as low as $0.07, while Solana dropped down to $11.74 with a 2 percent decline itself.

Polkadot price analysis: RSI lowers into deep oversold zone on daily chart
On the 24-hour candlestick chart for Polkadot price analysis, price can be seen depressing below the 9 and 21-day moving averages, along with the crucial 50-day exponential moving average (EMA) at $4.580. The immediate resistance faced by DOT price is at $5.00, and bulls will have to set up bullish momentum to achieve a run up to that point for the first time since December 16.

The relative strength index (RSI) on the 24-hour price action looks to be dropping deep into the oversold zone at 34.30. Whereas the moving average convergence divergence (MACD) curve can also be seen heading downwards below the signal line to show a bearish state. Aggressive traders may look for buying opportunities if price signals a run up to the $5 mark, while any drop below $4 could trigger dangerously low levels for Polkadot price.
Disclaimer. The information provided is not trading advice. Cryptopolitan.com holds no liability for any investments made based on the information provided on this page. We strongly recommend independent research and/or consultation with a qualified professional before making any investment decisions.
