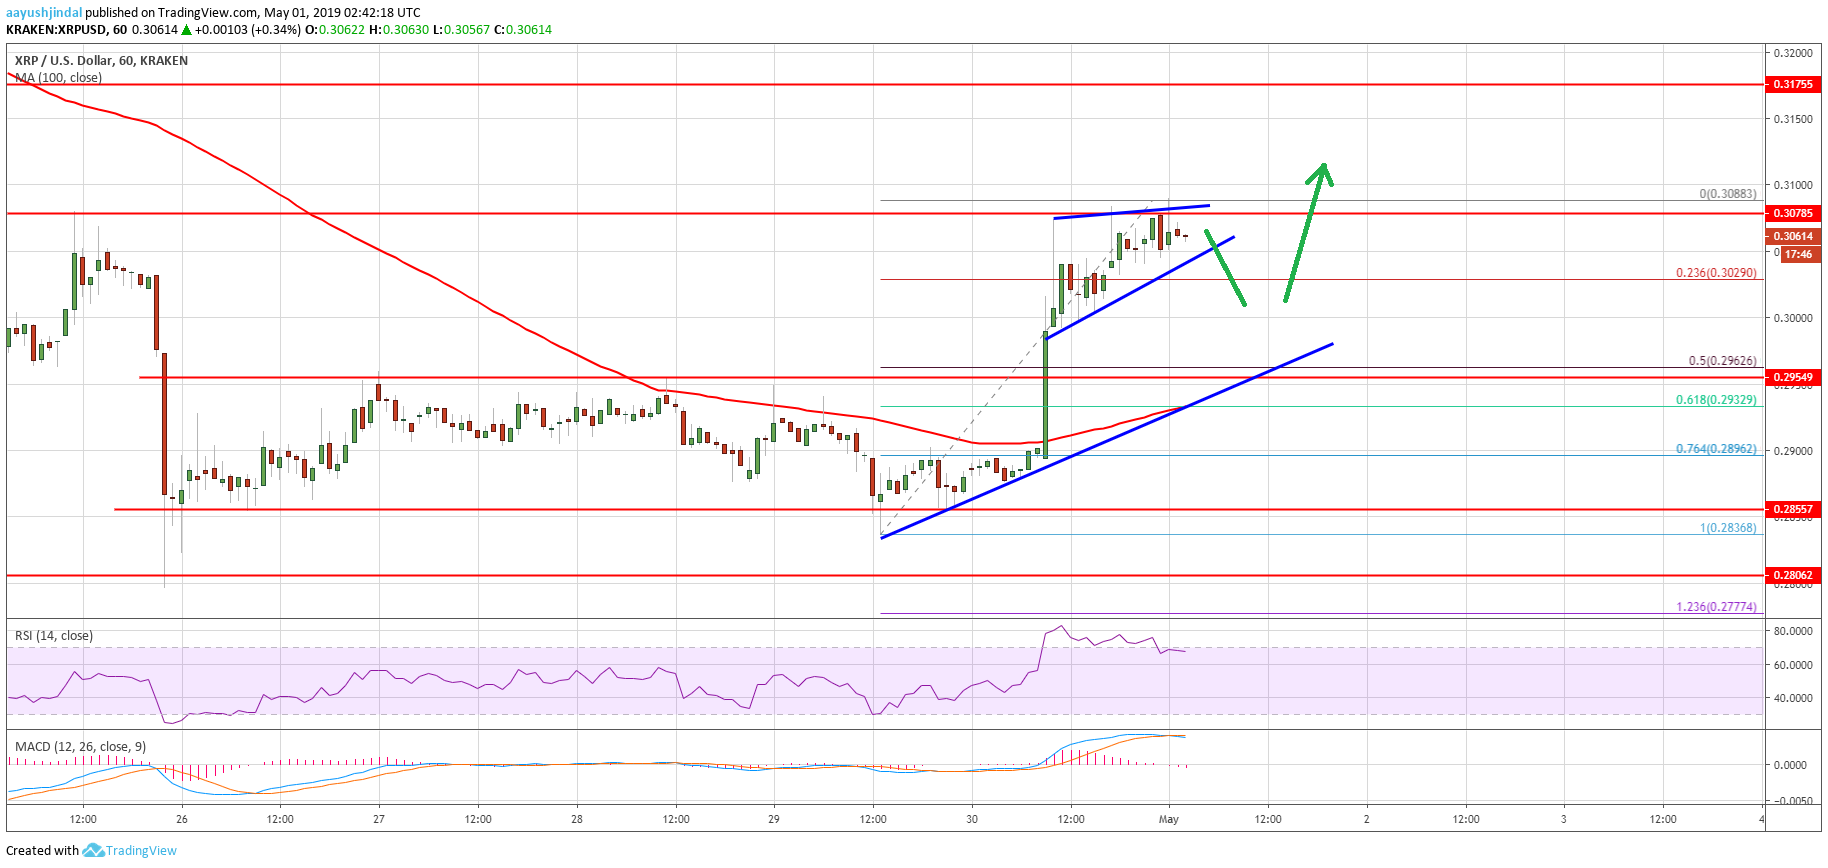
- Ripple price started a decent upward move and broke the $0.2960 resistance against the US dollar.
- Both bitcoin and Ethereum recovered and gained more than 2.5%.
- There is a short term breakout pattern forming with resistance near $0.3085 on the hourly chart of the XRP/USD pair (data source from Kraken).
- The pair could continue higher and it is likely to test the $0.3175 and $0.3200 resistance levels.
Ripple price starts a decent rebound against the US Dollar, along with bitcoin. XRP is currently trading with a positive bias and looks set to test the $0.3200 barrier.
Ripple Price Analysis
After a major drop, ripple price formed a strong support above the $0.2850 level against the US Dollar. The XRP/USD pair slowly climbed above the $0.2880 and $0.2900 resistance levels. Later, there was a close above the $0.2920 resistance level and the 100 hourly simple moving average. Besides, the price cleared the 61.8% Fib retracement level of the drop from the $0.3082 high to $0.2798 low. It opened the doors for more gains and the price spiked above the $0.3080 level.
A high was formed near the $0.3088 level and the price is currently consolidating gains. Furthermore, there is a short term breakout pattern forming with resistance near $0.3085 on the hourly chart of the XRP/USD pair. Below the triangle support, the 23.6% Fib retracement level of the recent wave from the $0.2836 low to $0.3088 high might act as a support. The next key support is near the $0.2960 level. The 50% Fib retracement level of the recent wave from the $0.2836 low to $0.3088 high is also near the $0.2960 level.
On the upside, a break above the $0.3085 and $0.3100 levels is likely to open the doors for more gains. The next key resistance is near the $0.3160 and $0.3175 levels. Above these, the price is likely to grind further higher towards the $0.3200 resistance level.

Looking at the chart, ripple price clearly climbed higher and it is currently consolidating gains above $0.3000. In the short term, there could be a downside correction towards $0.3000 or $0.2960. There is also a connecting bullish trend line in place with support near the $0.2960 level on the same chart. Therefore, dips remain well supported close to the $0.2960 level. To the topside, the main target for the bulls could be $0.3200 or even the $0.3220 pivot level.
Technical Indicators
Hourly MACD – The MACD for XRP/USD is slowly moving back in the bearish zone.
Hourly RSI (Relative Strength Index) – The RSI for XRP/USD is currently correcting lower towards the 60 and 55 levels.
Major Support Levels – $0.3020, $0.3000 and $0.2960.
Major Resistance Levels – $0.3085, $0.3160 and $0.3175.
The post Ripple (XRP) Price Poised for Further Appreciation: BTC, ETH Jumps appeared first on NewsBTC.
Source: https://www.newsbtc.com/2019/05/01/ripple-xrp-price-appreciation-btc-eth-jumps/
