Bitcoin has found itself in no man’s land. Take the chart below, which shows that over the past few months, the cryptocurrency has centered around the low-$9,000s,
Chart of BTC's price action over the past four months. Chart from TradingView.com
The stagnation in the cryptocurrency market has been further accentuated by volatility indicators.
Bitcoin’s historical volatility index has fallen under 40 for the first time since the February and March crash. Simultaneously, the width of the one-day Bollinger Bands has become the smallest since just days before Bitcoin plunged 50% in two weeks in November 2018.
Through this, BTC has become fundamentally stronger than ever.
Bitcoin Metrics Hit All-Time High
Bitcoin’s fundamental strength has been accentuated by Alistair Milne, the CIO of the Altana Digital Currency Fund. Milne divulged five metrics of the leading cryptocurrency making new all-time highs as of July 13th.
- The percent of all circulating BTC that hasn’t moved in a year has risen to 62%, a new all-time high.
- There are now a record number of BTC addresses holding over 0.1 coins, according to blockchain analytics firm Glassnode.
- The seven-day moving average of Bitcoin’s hash rate just set a new high.
- Following the hash rate, Bitcoin’s mining difficulty will also set a new high.
- Bitcoin’s order book has a “record bid-side” — a record amount of buy orders, in layman’s terms.
#Bitcoin is making ATH’s:
– record HODL’ing (>12 months)
– record number of addresses with >0.1BTC
– record mining hashrate
– record mining difficulty (in ~1 hour)
– record bid-side orderbook… price to follow?
— Alistair Milne (@alistairmilne) July 13, 2020
Price to Follow?
In his tweet on this data, Milne asked if Bitcoin will follow its fundamental metrics to the upside.
According to a number of analyses on two of the metrics he mentioned, it’s likely.
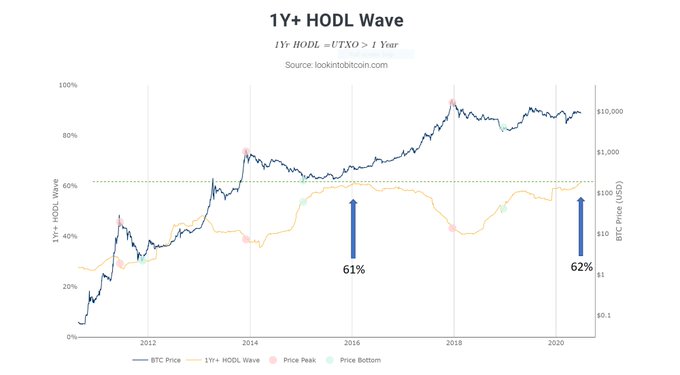
Philip Swift, an on-chain analyst, shared the chart below in June. It shows BTC’s price in relation to the “one-year HODL Wave,” which tracks the percentage of BTC not moved in a year or more.
As aforementioned, this metric just reached a new all-time high at 62%, suggesting BTC has more long-term investors than ever before.
The last time around this portion of the Bitcoin supply was locked up, a bull run began that brought BTC from under $1,000 to $20,000.
Chart of BTC's macro price action and the one-year HODL wave from Philip Swift (@PositiveCrypto on Twitter)
The strength in the hash rate of the network may also indicate the cryptocurrency industry’s macro bear market is on its last legs.
Charles Edwards in December published a model arguing that BTC’s value is derived from the energy consumption of the Bitcoin network. With an R squared value of 80%, suggesting a statistical correlation, the model says BTC is 28% undervalued after the surge in hash rate.
Featured Image from Shutterstock
Price tags: btcusd, xbtusd, btcusd, btcusdt
Charts from TradingView.com
5 BTC Metrics Are Making Highs Says Fund Manager: Could Price Follow?


