The Chainlink rally has slowed down recently; here’s what the various LINK on-chain metrics look like to see if the surge has hope of a restart.
Chainlink Has Registered Some Drawdown In The Past 24 Hours
Just during the weekend, Chainlink had been floating above the $16 mark, but winds seem to have shifted for the coin in the past couple of days, as it has registered some drawdown.
During the last 24 hours alone, LINK has dropped around 6%, leading to its price slipping below the $14 level. The chart below shows how the cryptocurrency has performed in the past month.
As displayed above, Chainlink had been riding some sharp bullish momentum in this period before this latest plunge, as the asset had more than doubled in value. Despite the decline, LINK is still up over 90% in the past month, which is an impressive return.
Naturally, the investors may be wondering now if the asset has already hit its peak for this rally or if there is more to come shortly. It’s hard to say anything about that, but perhaps on-chain data could provide some hints.
LINK Activity Has Been Relatively High Recently
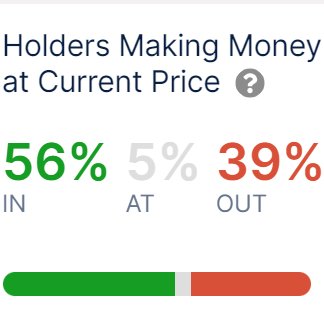
In a new post on X, the market intelligence platform IntoTheBlock has shared the data of some Chainlink on-chain indicators. First, when the firm made the post, about 56% of the asset’s investors were sitting on some profit.
The cryptocurrency had then been floating at higher levels than currently (although not too high), so more LINK addresses would have entered a state of loss by now.
Generally, investors in profit are more likely to sell at any point, so a large amount of them being in the green could raise the probability of a selloff. Some Chainlink investors are currently harvesting their profits, but the profitability ratio is still not skewed that much towards profits.
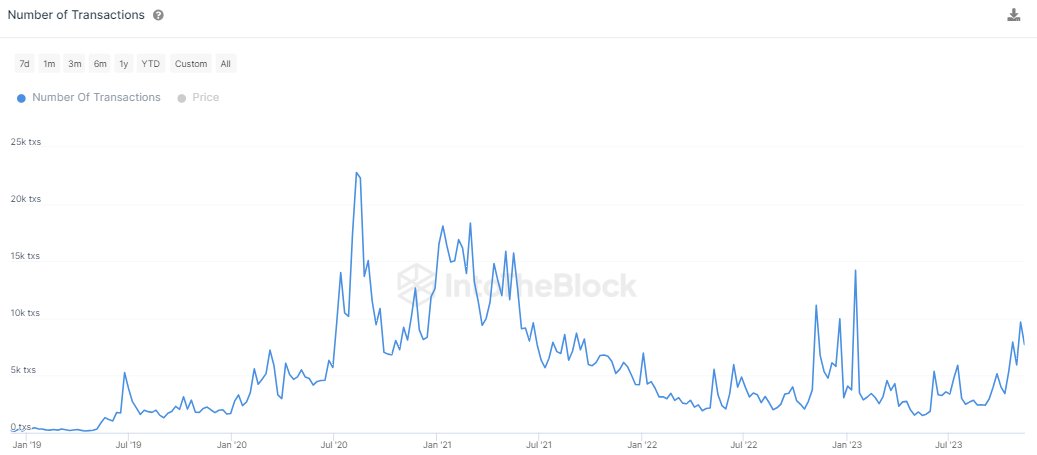
Next, IntoTheBlock has talked about the number of transactions on the network.
“The Chainlink network is showing many positive signs in terms of transaction data,” says the intelligence platform. “Notably, we see a healthy increase in the number of transactions.”
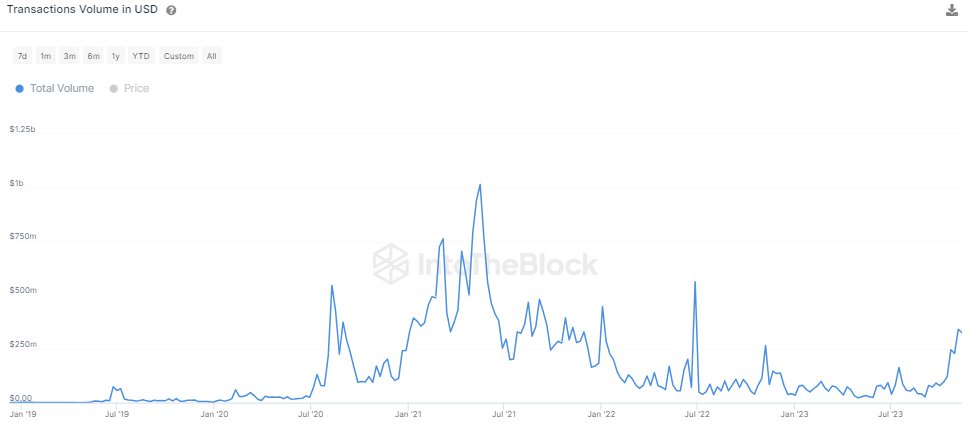
The number of transactions is up 436% from the monthly lows, and as is usually the case, the volume has also spiked alongside this rise.
The transaction activity being high suggests there is interest behind the asset, and so, the price action shouldn’t go stale just yet. However, the volatility due to this activity can go either way, as the asset is already witnessing.
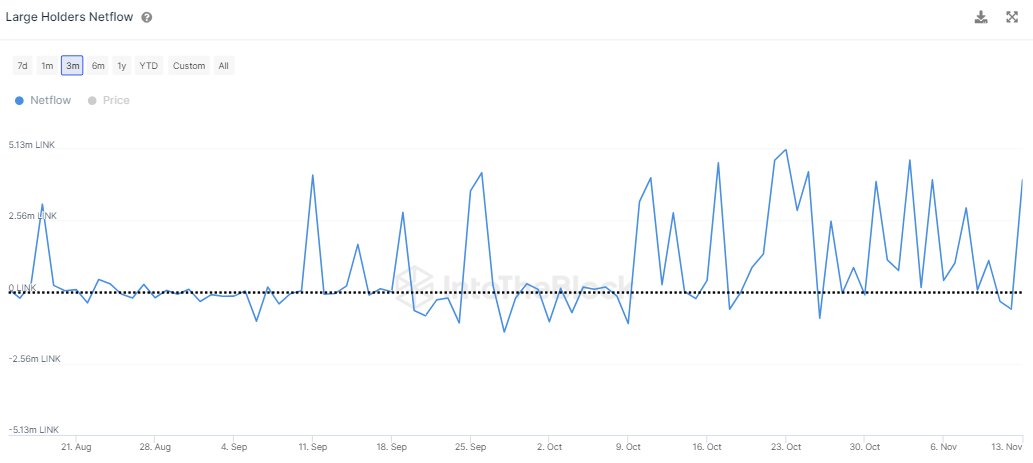
A metric that could more solidly point at a direction for the cryptocurrency is the large holder netflow, which keeps track of the net accumulation/distribution behavior over the last month for LINK holders carrying more than 1% of the supply.
As is visible in the chart, the large Chainlink holders have been buying recently, which could potentially be a positive sign for the asset. This doesn’t have to mean that the rally would restart shortly, of course, but it does provide some support for the idea.
Source: https://www.newsbtc.com/chainlink-news/chainlink-declines-5-rally-over-there-more-go/


