Binance Coin price analysis continues to show a bearish reading, after price failed to breakout over the past 24 hours from the $250 support zone. Over the past week, BNB price has declined over 12 percent after starting off at around $253. Today’s trade saw a low of $239.5, which could form the lower support zone if price declines further. As trading volume and volatility remain low, BNB price could drop further after failing to attract buyers. Over the past 10 days, BNB price has lowered from $289.7 to today’s low of $239.5, recording a 17 percent decrement.
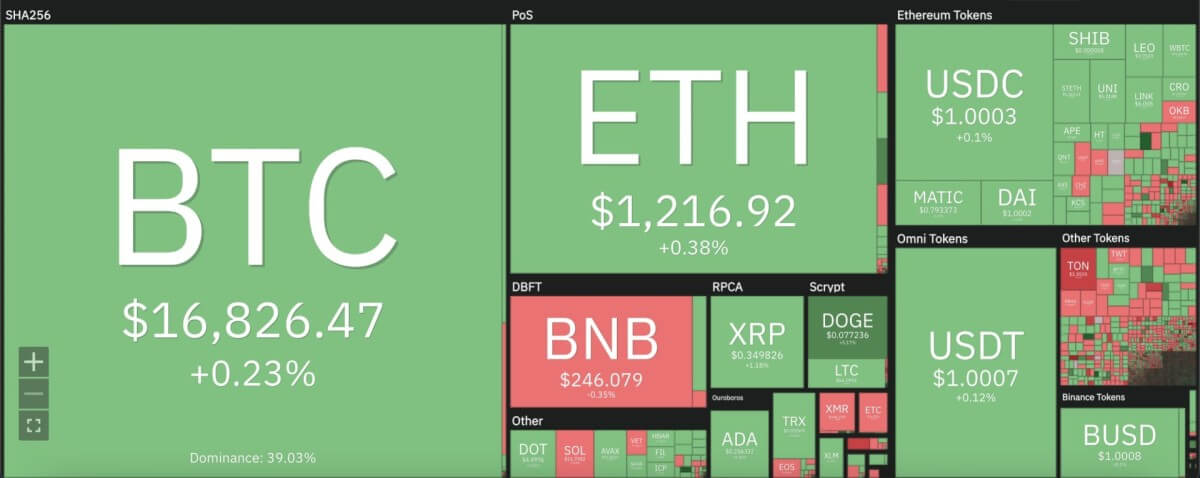
The larger cryptocurrency market recorded minor increments over their incumbent price zones, as Bitcoin continued its pursuit of the $17,000 mark, sitting at $16,800. Ethereum also remained at $1,200, whereas leading Altcoins also showed slight increments. Ripple climbed up to $0.35 with a 1 percent uptrend, while Dogecoin gained 5 percent to move up to $0.07. Cardano also rose $1.5 percent, moving up to $0.25. Meanwhile, Solana dropped 3 percent to move down to $11.79, as Polkadot remained just below the $4.5 mark.

Binance Coin price analysis: BNB price slides below moving averages on daily chart
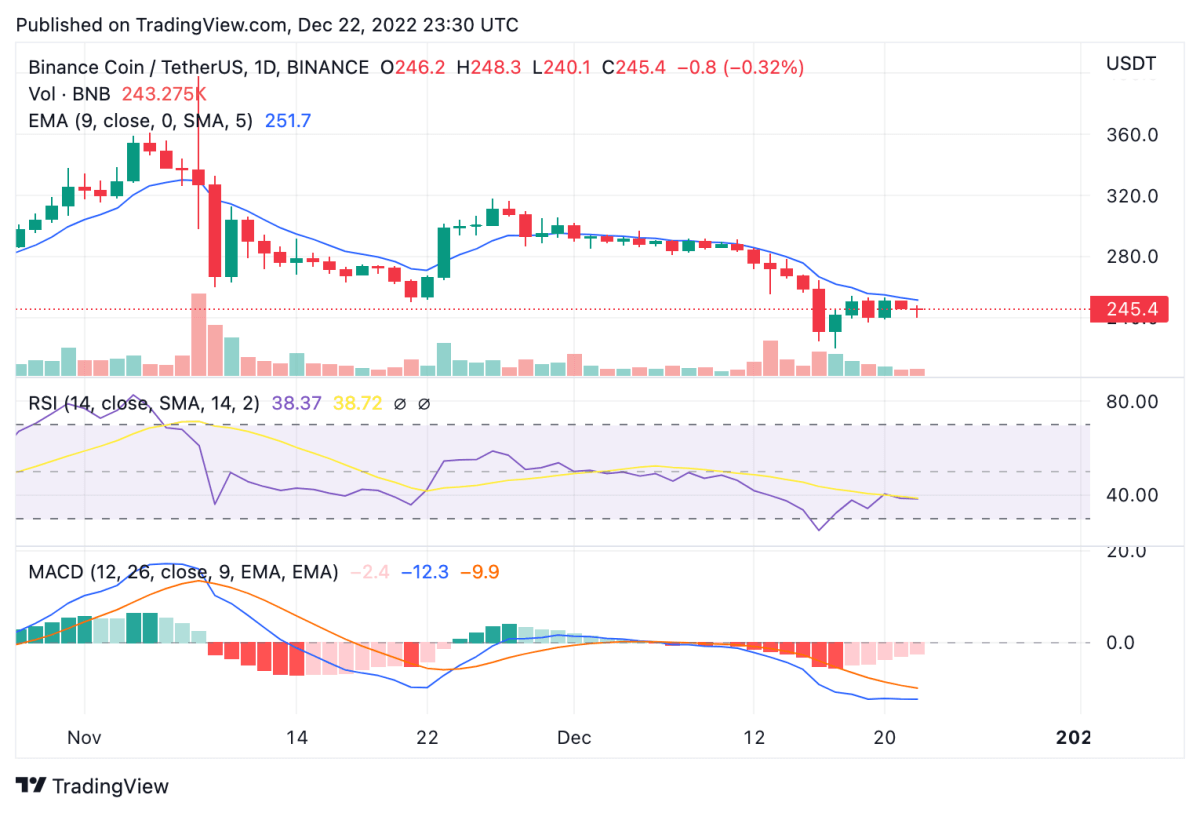
On the 24-hour candlestick chart for Binance Coin price analysis, price can be seen forming a sideways trend around the $245 mark, after falling down to a low of $222 on December 17. Since then, BNB has failed to breakout past the current support zone at $245 and could drop down to $240 over the next 24 hours. Trading volume saw a 15 percent increase, suggesting some market interest which could hint at the revival of the $250 mark that could propel BNB up to $255 on the daily chart.

However, price on the daily chart shows movement over the past 24 hours to take price below the 9 and 21-day moving averages, along with the crucial 50-day exponential moving average (EMA) at $252. The 24-hour relative strength index (RSI) shows a lowly reading in the oversold region at 38.37, whereas the moving average convergence divergence (MACD) curve displays a bearish divergence in place below the signal line.
Disclaimer. The information provided is not trading advice. Cryptopolitan.com holds no liability for any investments made based on the information provided on this page. We strongly recommend independent research and/or consultation with a qualified professional before making any investment decisions.
