Cardano price analysis continues to show positive signs, as price reached up to $0.44 during the day’s trade to record a month-long high. ADA looks on course to achieve the $0.5 bullish target for November, after gaining more than 3 percent over the past 24 hours. Price trended upwards for the second successive 24-hour trading session, after Thursday’s 4 percent decline down to $0.38. Support over the current trend sits at $0.35 whereas the next resistance point for ADA would be the September 18 high of $0.488.
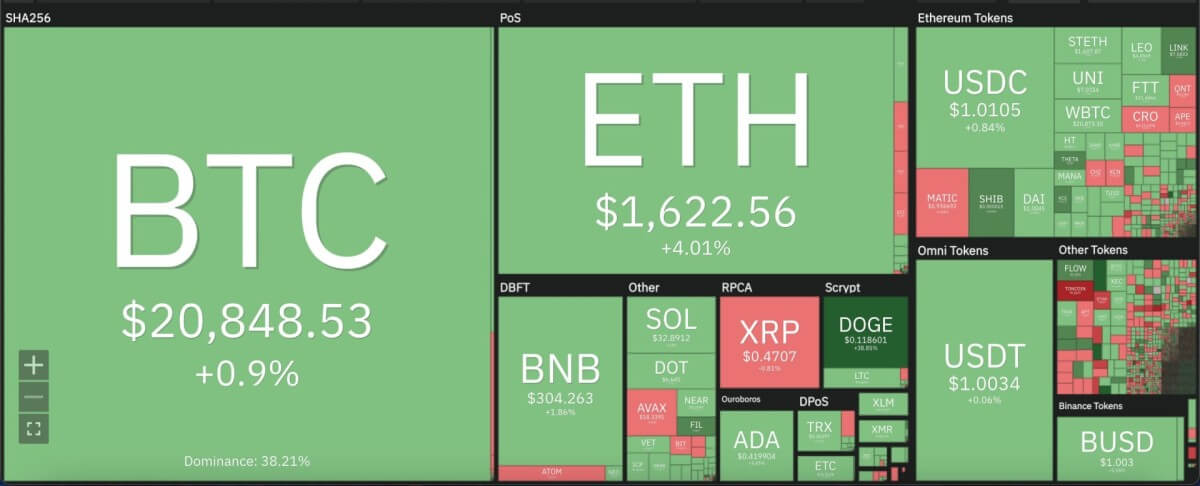
The larger cryptocurrency market continued to strengthen from yesterday, as Bitcoin moved into touching distance of the $21,000 mark, whereas Ethereum gained 4 percent to move up to $1,600. Among Altcoins, Dogecoin gained a massive 38 percent to boost up to $0.11, with Ripple consolidating around the $0.47 mark. Meanwhile, Solana rose 2 percent to $32.89, and Polkadot made a 2 percent increment to settle at $6.64.

Cardano price analysis: 24-hour RSI could be headed into overbought zone on daily chart
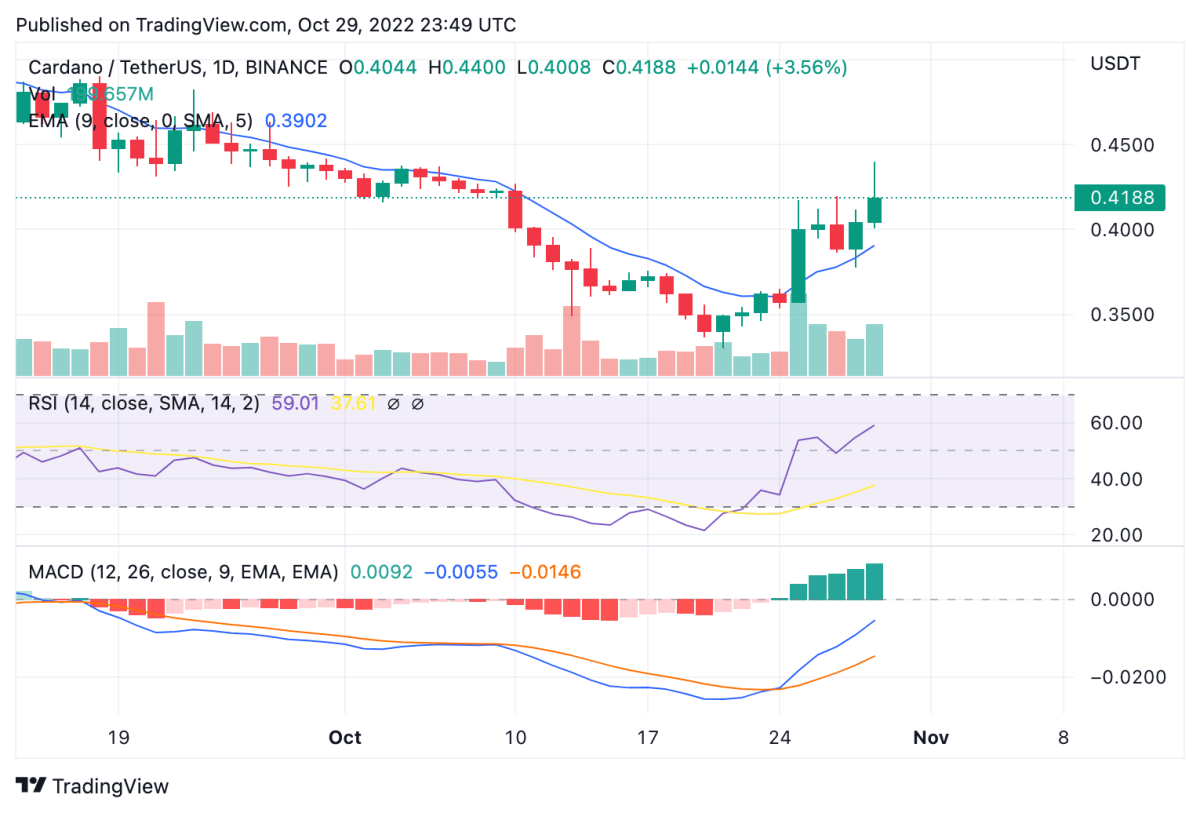
On the 24-hour candlestick chart for Cardano price analysis, price can be seen building upon yesterday’s upward shift in trend to consolidate upwards. Price picked up more than 3 percent to move up to as high as $0.44, before moving down to $0.42 at the time of writing. This could signal chances for a downward movement in ADA price, as trading volume also rose up by 36 percent over the day’s trade. Price currently sits well above the $0.35 support, along with the 9 and 21-day moving averages and the 50-day exponential moving average (EMA) at $0.39.

The 24-hour relative strength index (RSI) has also raced up to reach up to 60, which could be considered as a move into the overbought zone. ADA bulls could be vary of potential sell offs initiating with the increasing RSI, which make the coming trading sessions moving into next week crucial. Meanwhile, the moving average convergence divergence (MACD) curve continues to show a bullish divergence above the neutral zone, but could retrace downwards according to upcoming price action over the next 24-48 hours where price could retest down to $0.38.
Disclaimer. The information provided is not trading advice. Cryptopolitan.com holds no liability for any investments made based on the information provided on this page. We strongly recommend independent research and/or consultation with a qualified professional before making any investment decisions.
