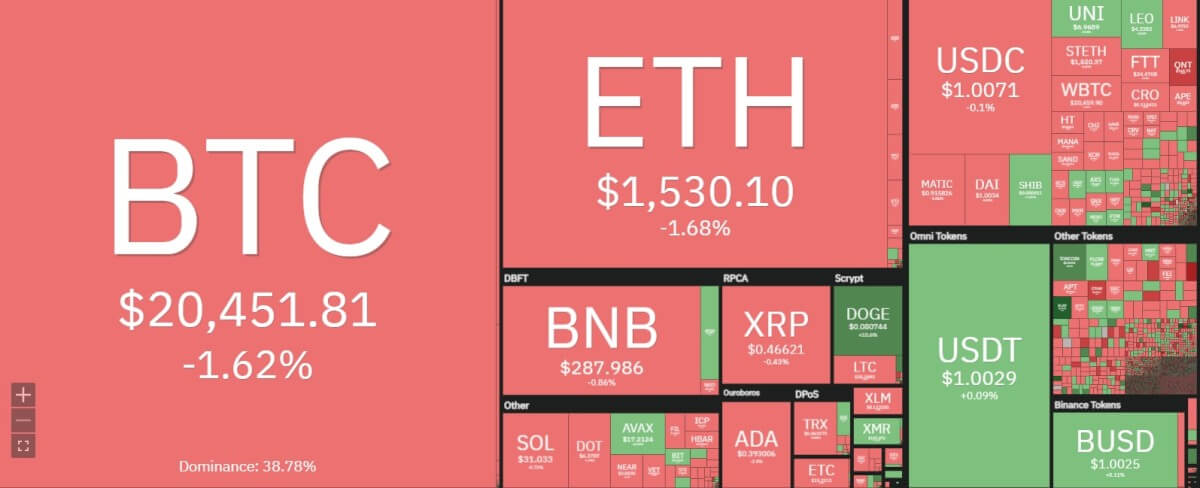
Bitcoin price analysis shows another Bollinger band squeeze on the way with contracting price action. The BTC/USD pair is struggling to maintain the $20,000 level and is oscillating near $20,400 region with a downward bias. The upward movement from the $19,800 level is not confident and it seems the bulls are faltering.

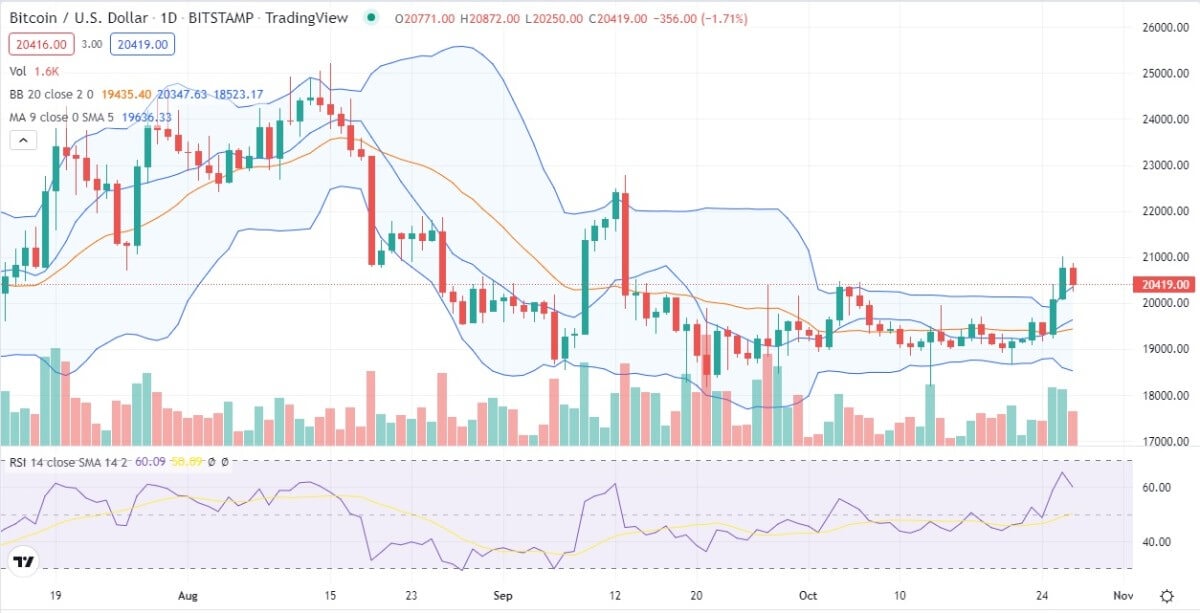
The Bollinger bands on the daily timeframe chart is not showing any major upward movement. On the contrary, the region near $19,000 is raising a concern regarding contraction in the Bollinger Bands. In such a scenario, the Bollinger Bands will likely cause the price to trade in a thin range.
Bitcoin price movement in the last 24 hours: Volumes required for a directional move
A sustainable trend is yet to form on the hourly charts. The daily charts are showing a slight bias upwards but the same needs to be established as the day comes to a close. The high trading volumes along with decent upshot can turn the tables for the bulls. The recent sideways phase must end on the daily charts for the BTC/USD to move beyond $24,000.

The next bullish targets are $21,000 and then $25,000 where the pair is bound to meet stiff resistance. The journey, however, is not going to be smooth as the pair is moving towards the middle of the Bollinger Bands near $19,800 range on the hourly timeframe as per Bitcoin price analysis. The pair has successfully made beyond the 50-day moving average and seeks to cross the 200-day moving average which is showing a slight bent downwards.
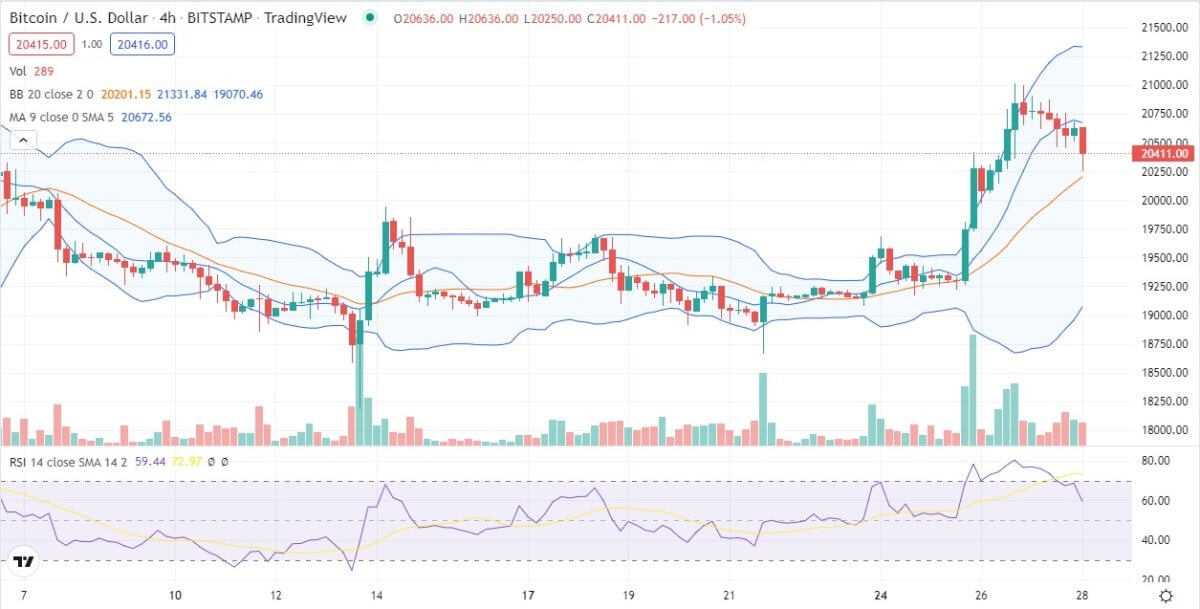
BTC/USD 4-hour price chart: Technical indicators forecast a range bound movement
According to Bitcoin price analysis, the Ichimoku cloud is showing a slight retracement before the pair can chart its further course higher. The last attempt to move above the Ichimoku cloud only led to the pair falling near $19,000. So, the bulls must maintain both momentum and the volumes required to cross resistance at $21,000.

The daily parabolic SAR is showing a dip towards $20,000 where the stop losses are likely to be triggered paving the exit path for short-sellers. A short squeeze is also not ruled out on the charts. The Bitcoin price analysis depicts a similar story for the RSI and MACD indicators as well. The pair is looking upwards but the volume data is not supportive. The short-term price action squeeze can definitely led to a fall in the prices as per Bitcoin price analysis.
Bitcoin price analysis conclusion: BTC set to trade in a tight range close to $20k
The earlier bottom of the bear movement is close to the current price levels at $20,000. This can usher in hopes for the bulls. However, the daily chart timeframes are not painting a rosy picture. At the moment, the resistance that beckons the bears is $21,000 where the short orders are piling up rapidly.
The bigger timeframes are also indicating a slow but steady build up of volumes. The BTC whales are nowhere in the picture with the pair getting support from the retail investors. The institutional investors are also not making a decisive move yet. The dynamic resistance between $20,900 to $21,400 is making matters difficult for the pair.
Disclaimer. The information provided is not trading advice. Cryptopolitan.com holds no liability for any investments made based on the information provided on this page. We strongly recommend independent research and/or consultation with a qualified professional before making any investment decisions.
