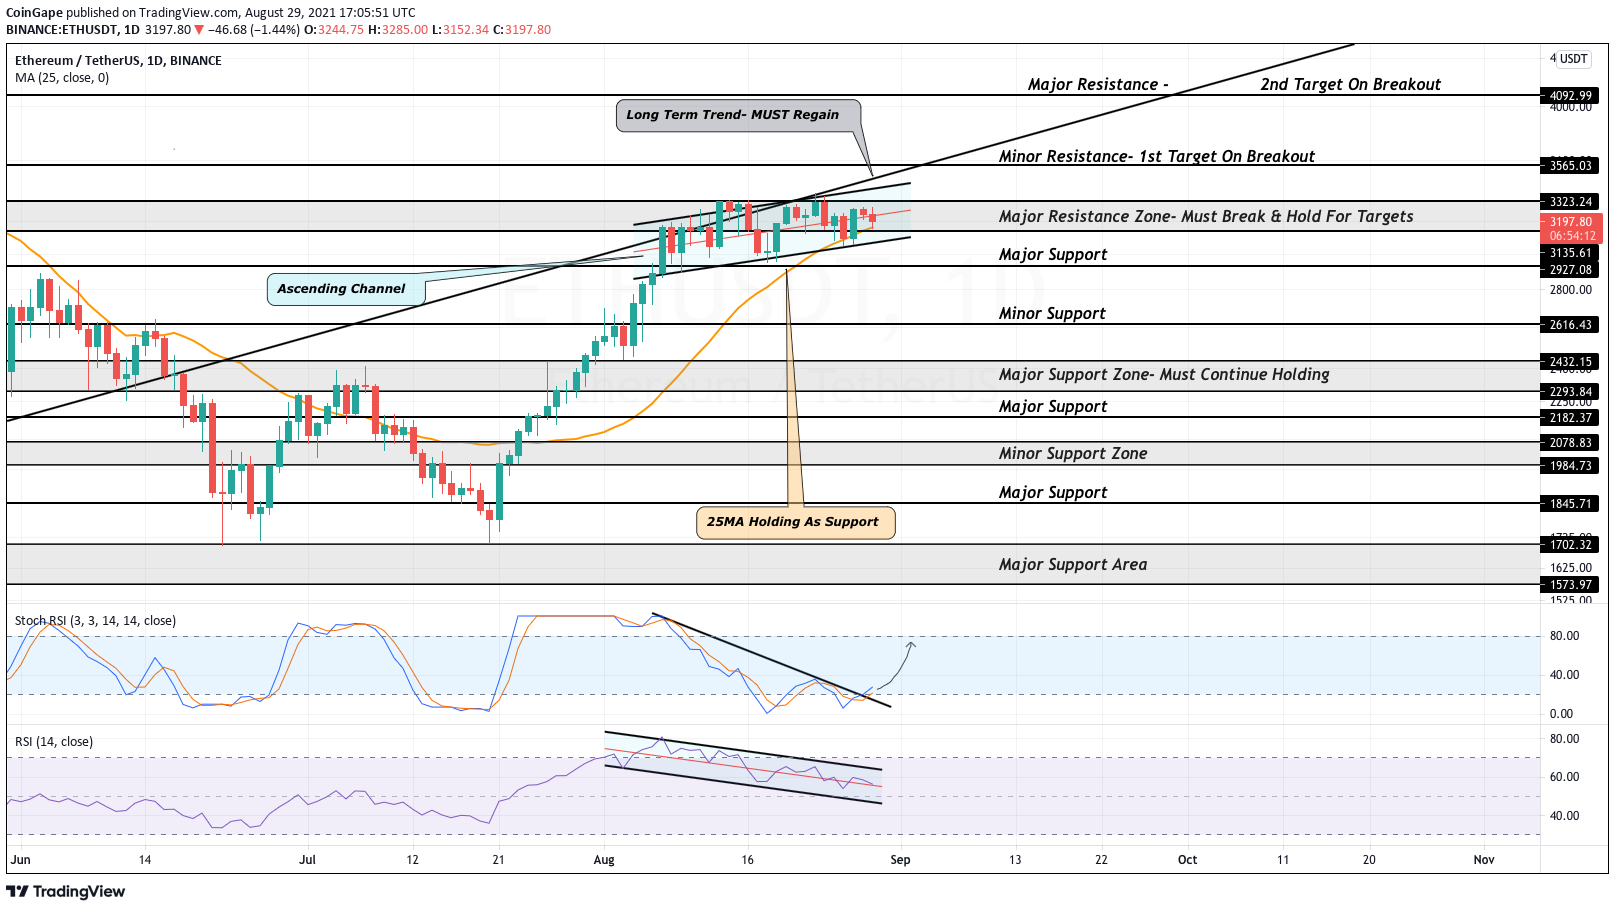

- ETH price has stayed flat over the last week
- ETH Price has been attempting to break over 8 month trend line
- 25 day MA is acting as support
Major ETH Price Levels to Watch
Ethereum (ETH) usage has skyrocketed over the last month thanks to the ongoing NFT boom. Opensea, the largest NFT marketplace that runs on ETH, has experienced an explosion in volume over the month of August. Since this has occurred, the price of ETH price has stayed relatively steady as it consolidates awaiting its next move. BTC has also been steady over the last few weeks as the market awaits the start of its next move. Based on the technicals, ETH & BTC should breakout within the next week.
Since, ETH has surged nearly 100% off its $1700 low, price has been halted at a major trend line that was support for over 6 months. Bulls must break over this mark for ETH price to experience a large surge to the $4000 level. Since the beginning of August , volatility has subsided as ETH has stayed between $3000-$3300. This price action has formed an ascending channel which price has respected tremendously. For Ethereum (ETH) to confirm another bullish move, price must break & hold the major resistance found at $3323. If this is deemed successful, we can expect ETH to hit $3500 fairly soon.
Ethereum Price Analysis: ETH/USDT 1 Day Chart

In the case that bears take over & ETH price breaks to the downside of its ascending channel, we should expect price to land at the major support of $2927. Before this can occur, bears must pull ETH below the 25 day MA, which may be a struggle. This MA has held ETH up ever since price broke above the $2000 mark. If ETH price fails to break to the upside & breaks below the 25 day MA, we can then confirm Ethereum (ETH) to be in a short term bear trend which may land prices back to $2500.
- While looking at the Stochastic RSI, we can see how strength just spent over a week within the oversold region. Despite price staying steady, strength dropped tremendously which may indicate ETH just gained the power for another bullish push. Breaking above the 50 value will confirm this view.
- The regular RSI has been downtrending within a descending channel which is a healthy sign as long as it stays above the 50 value. Breaking to the upside of this channel will confirm another bullish push.
ETH Intraday Analysis
- Spot rate: $3199
- Trend: Neutral
- Volatility: High
- Support: $3135
- Resistance: $3323
The post ETH Price Analysis: Ethereum (ETH) Stuck at 8 Month Trendline, What’s Next $3500 Or $2900? appeared first on Coingape.
