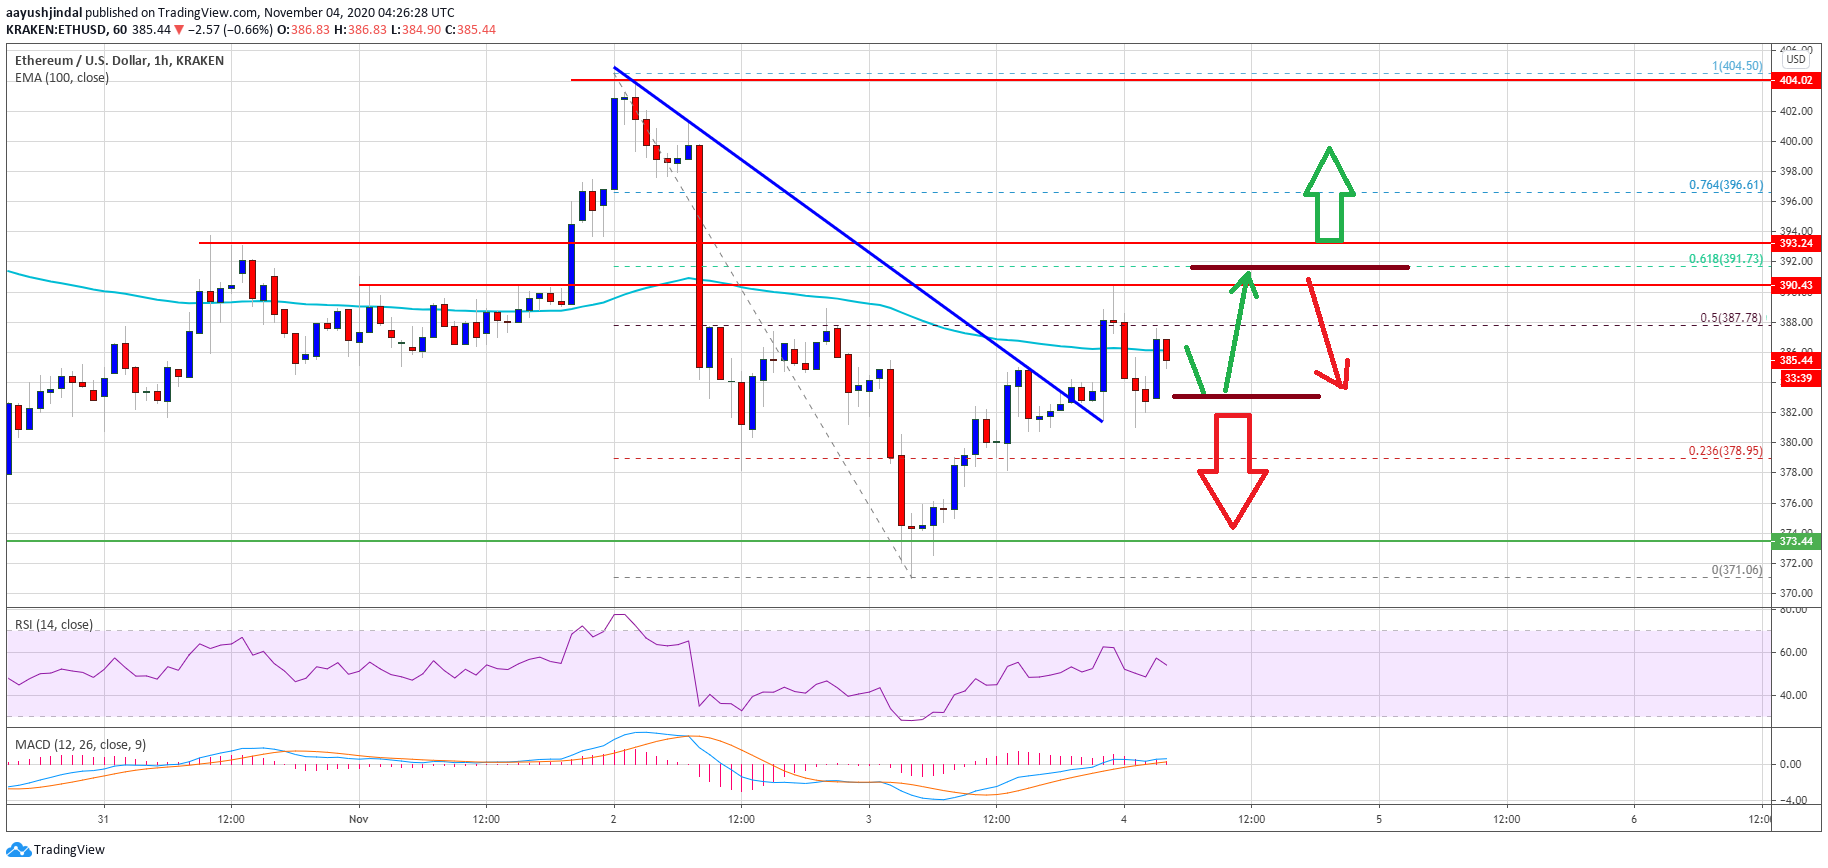
Ethereum’s ether stayed above the $372 support and recovered nicely against the US Dollar. ETH price is now struggling to clear $392, above which it could rally significantly.
- Ethereum started a decent recovery wave after it found support near the $372 level.
- The price is now trading above $382 and testing the 100 hourly simple moving average.
- There was a break above a key connecting bearish trend line with resistance near $384 on the hourly chart of ETH/USD (data feed via Kraken).
- The pair must settle above $392 to initiate a strong rally in the coming sessions.
Ethereum Price is Attempting Upside Break
After diving towards the $372 support, Ethereum held the ground and started a decent upward move. ETH price broke the $380 resistance level to move into a short-term bullish zone.
The upward move was such that ether price surpassed the 23.6% Fib retracement level of the downward move from the $404 swing high to $371 swing low. Moreover, there was a break above a key connecting bearish trend line with resistance near $384 on the hourly chart of ETH/USD.
The price is now facing hurdles near $388 and $390. The 50% Fib retracement level of the downward move from the $404 swing high to $371 swing low is also acting as a resistance. It is now trading above $382 and testing the 100 hourly simple moving average.
Source: ETHUSD on TradingView.com
To start a strong rally, ether must clear the $390 resistance and then settle above $392. A successful close above the $392 resistance may perhaps initiate a larger upward move (similar to bitcoin if it clears $14,000) towards the $405 and $412 levels. Any further gains could lead the price towards the $420 resistance level.
Downside Limited in ETH?
If Ethereum fails to clear the $390 and $392 resistance levels, it could react to the downside. An initial support on the downside is near the $382 level.
The first major support is near the $380 level. A clear break below $380 could start another decline towards the main $372 support level. Any more losses is likely to push ether towards the $365 level in the coming sessions.
Technical Indicators
Hourly MACD – The MACD for ETH/USD is slowly gaining momentum in the bullish zone.
Hourly RSI – The RSI for ETH/USD is now well above the 50 level.
Major Support Level – $380
Major Resistance Level – $392
Source: https://www.newsbtc.com/analysis/eth/ethereum-recovers-close-above-392-imp/

