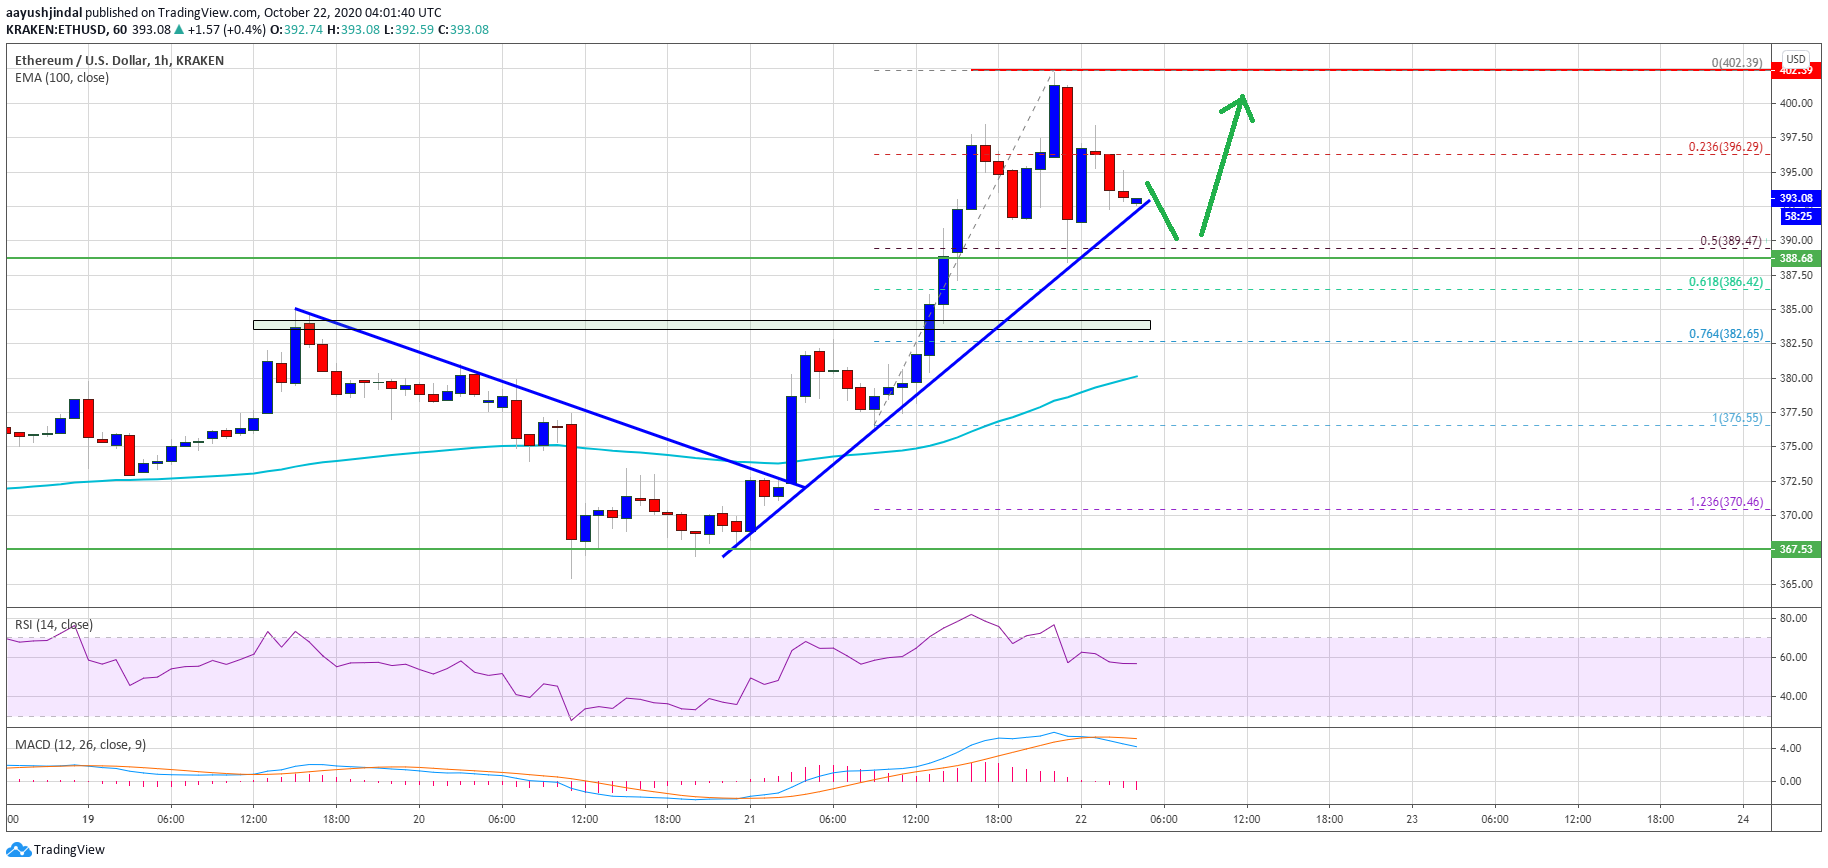
Ethereum surged over 5% and it even spiked above the $400 resistance against the US Dollar. ETH price is struggling to clear the $400 resistance, but is remains well supported.
- Ethereum started a strong upward move above the $385 and $392 resistance levels.
- The price traded to a new monthly high at $402 and it settled above the 100 hourly simple moving average.
- There is a key connecting bullish trend line forming with support near $392 on the hourly chart of ETH/USD (data feed via Kraken).
- The pair could correct a few points, but there are many important supports at $388 and $385.
Ethereum Price Turns Green
Ethereum followed bitcoin’s rally and started a strong rally above the $380 resistance. ETH price broke the $385 and $392 resistance levels to move further into a positive zone.
The upward move was such that ether price even spiked above the $400 resistance. A new monthly high was formed near $402 and the price is now trading well above the 100 hourly simple moving average.
After a rejection above the $400 level, there was a sharp downside correction. The price broke the $395 level, and the 23.6% Fib retracement level of the recent rally from the $376 swing low to $402 high. The price even tested the $390 support level.
Source: ETHUSD on TradingView.com
It seems like there is a key connecting bullish trend line forming with support near $392 on the hourly chart of ETH/USD. The next major support is near the $390 level since it is close to the 50% Fib retracement level of the recent rally from the $376 swing low to $402 high.
On the upside, the $400 level is a massive resistance for the bulls. The next immediate resistance is near the $402 swing high, above which ether is likely to climb higher towards the $412 level. A clear break above the $412 resistance could open the doors for a test of $420.
Dips Likely Supported in ETH
If Ethereum fails to clear the $400 resistance level, it might continue to correct lower. The first major support is near the trend line, followed by $390.
A downside break below the $390 support level could lead the price towards the $385 support. The main support is near the $382 level (the recent breakout zone).
Technical Indicators
Hourly MACD – The MACD for ETH/USD is slowly moving in the bearish zone.
Hourly RSI – The RSI for ETH/USD is still well above the 50 level.
Major Support Level – $390
Major Resistance Level – $400
Source: https://www.newsbtc.com/analysis/eth/ethereum-facing-huge-hurdle-at-400/

