- Litecoin started a strong upward move from the $41.50 support zone against the US Dollar.
- The price is now trading nicely above the $50.00 level and the 100-day simple moving average.
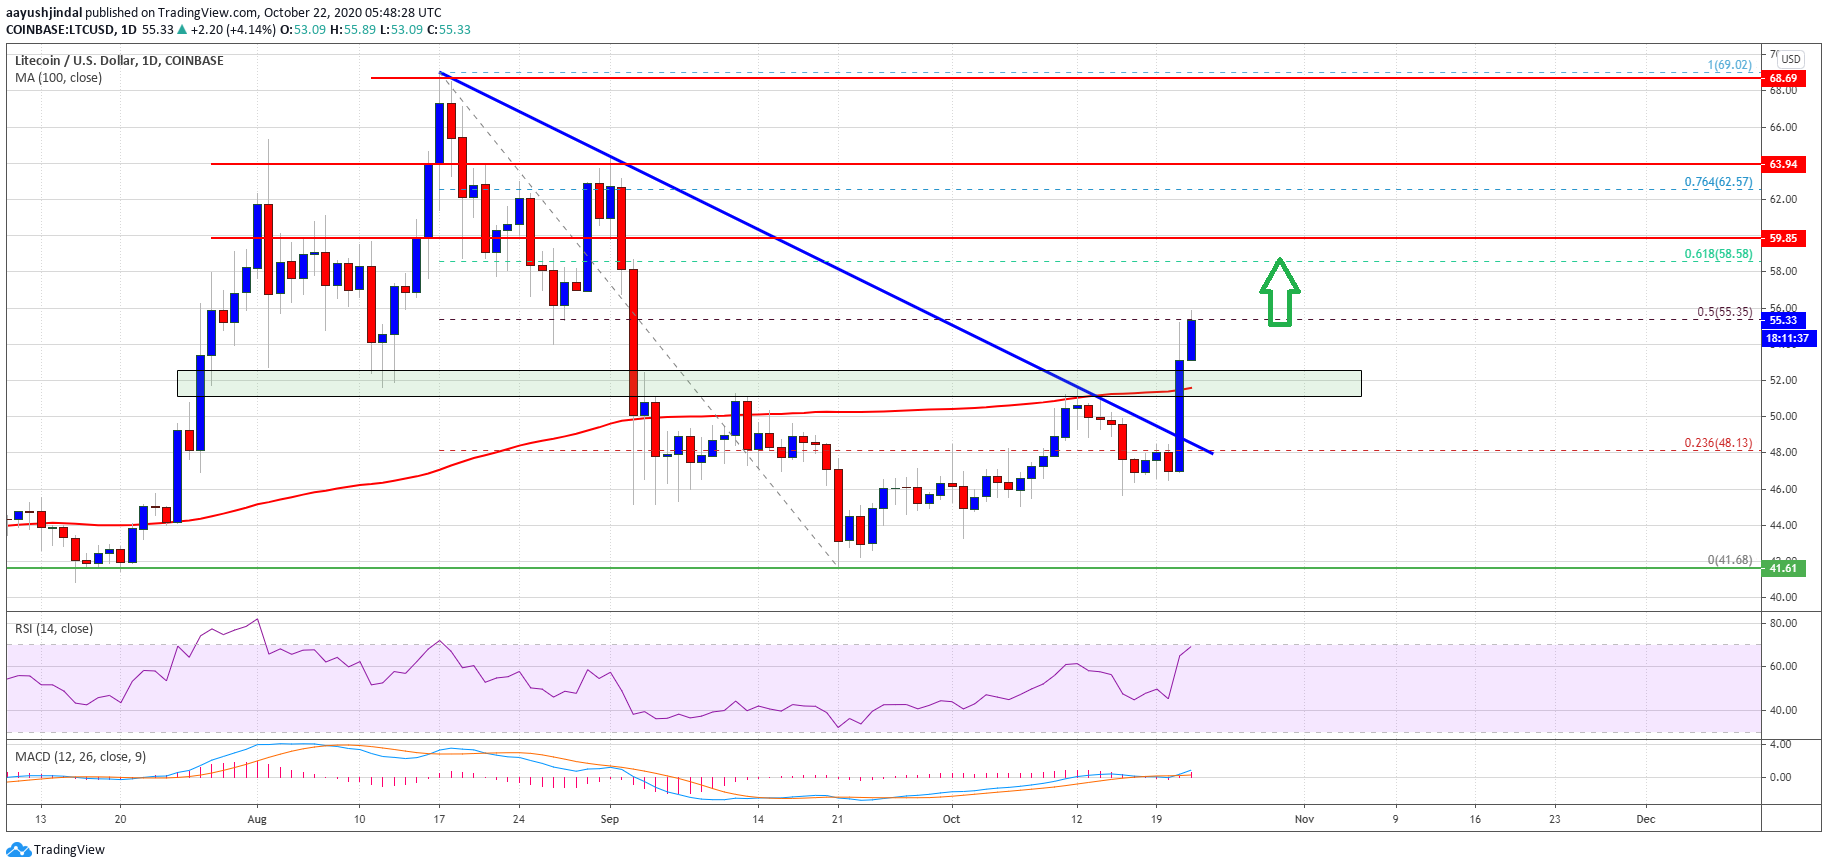
- There was a break above a crucial bearish trend line with resistance near $48.90 on the daily chart of the LTC/USD pair (data feed from Kraken).
- The bulls seem to be aiming a larger upward move towards the $60.00 and $65.00 levels.
Litecoin price is gaining momentum above $55.00 against the US Dollar. LTC is likely to continue higher towards $60.00 or $65.00 as long as it is above the 100-day SMA.
Litecoin Price is Forming Strong Uptrend
Recently, the crypto market gained traction, and there was a strong increase in bitcoin, Ethereum, ripple and litecoin against the US Dollar. Earlier, LTC formed a strong support above the $41.50 on the daily timeframe before staring the current increase.
There was a clear break above the $48.00 and $50.00 resistance levels. There was also a break above a crucial bearish trend line with resistance near $48.90 on the daily chart of the LTC/USD pair
It opened the doors for more upsides above the $52.00 level and the 100-day simple moving average. Litecoin even climbed above the $55.00 level, and it is now testing the 50% Fib retracement level of the downward move from the $69.02 high to $41.68 low.
Source: LTCUSD on TradingView.com
The next major resistance is near the $58.80 level. It is close to the 61.8% Fib retracement level of the downward move from the $69.02 high to $41.68 low. The next key resistance is near the $60.00 level, above which the price is likely to surge towards the $65.00 and $68.00 levels in the near term.
Dips Likely Supported in LTC
If litecoin fails to continue above the $56.00 resistance or the $58.80 zone, there are chances of a downside correction. On the downside, the first major support is near the $52.00 level.
The main support is now forming near the $50.00 level and the 100-day simple moving average. Any further losses might change the trend and the price might dive towards $45.00 or even $41.50 in the coming days.
Technical indicators:
4-hours MACD – The MACD is showing positive signs in the bullish zone.
4-hours RSI (Relative Strength Index) – The RSI for LTC/USD is currently rising and it is well above the 60 level.
Major Support Levels – $52.00 followed by $50.00.
Major Resistance Levels – $58.80 and $60.00.

