Ripple started a steady decline and traded below the $0.2500 support against the US Dollar. XRP price is showing bearish signs and it might slide further below $0.2375.
- Ripple failed to stay above the $0.2500 support and extended its decline against the US dollar.
- The price is now trading below the $0.2450 support and the 100 hourly simple moving average.
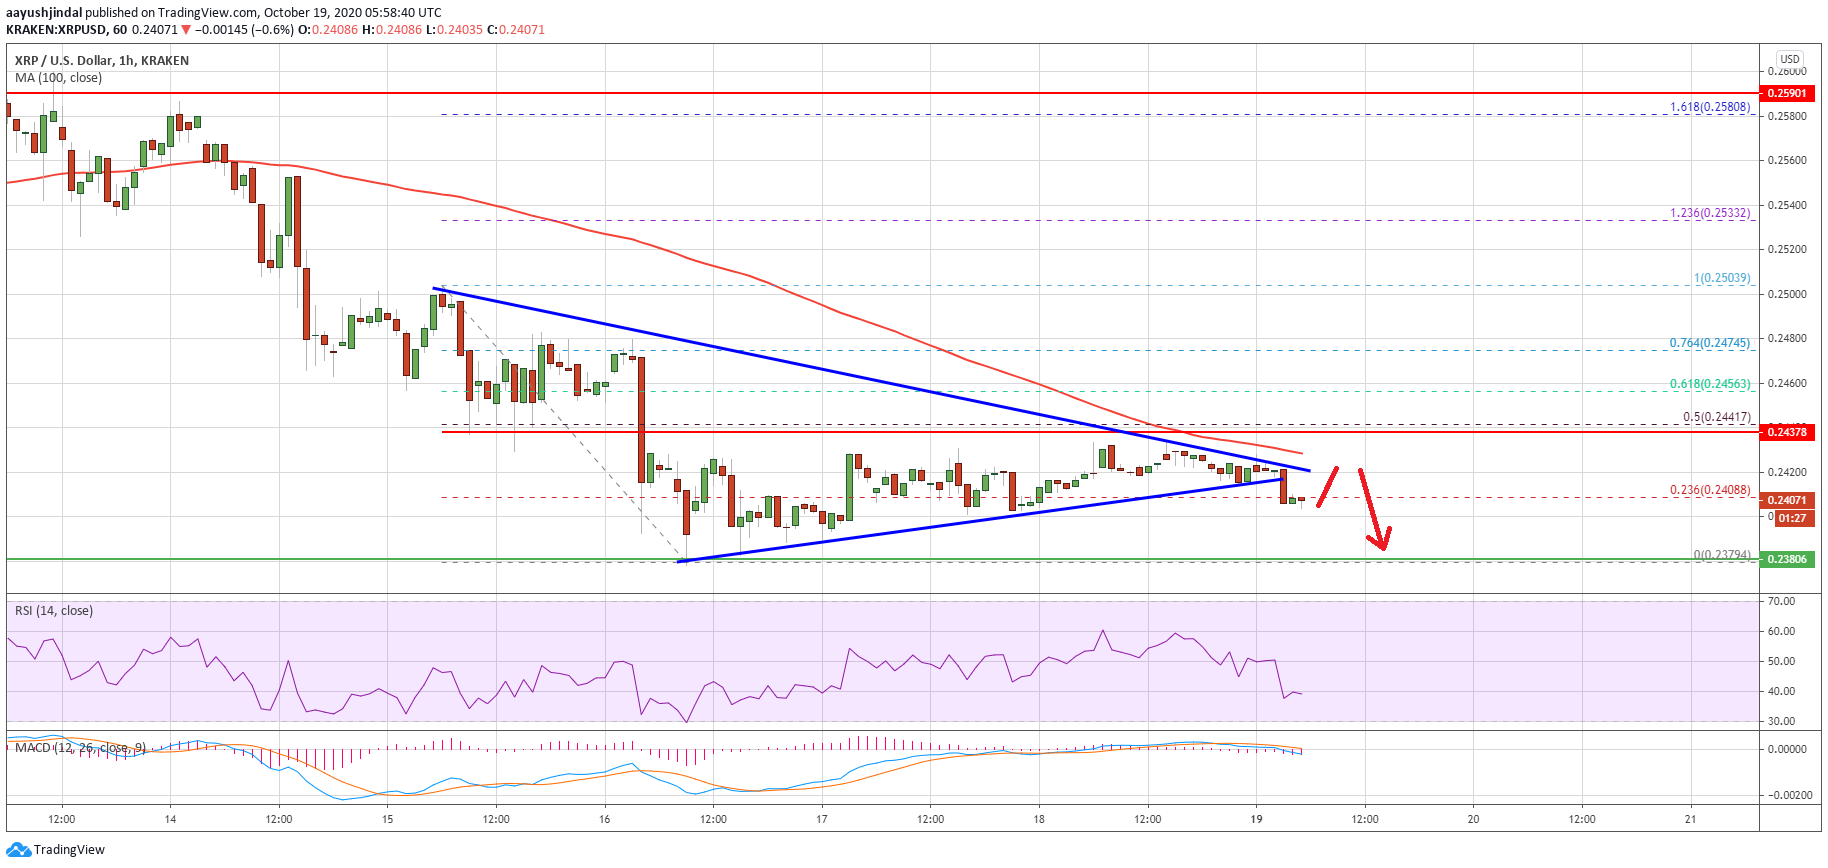
- There was a break below a key contracting triangle with support at $0.2415 on the hourly chart of the XRP/USD pair (data source from Kraken).
- The pair is likely to continue lower towards the $0.2350 support or even $0.2320.
Ripple Price Turns Red
This past week, we saw a sharp rejection in ripple near the $0.2600 area. XRP price topped near the $0.2595-$0.2600 resistance zone and started a fresh decline. It broke many important supports near $0.2500 to move into a bearish zone.
The decline was such that the price settled below the $0.2450 level and the 100 hourly simple moving average. It spiked below the $0.2400 support and traded as low as $0.2379. Recently, there was a short-term upside correction above the $0.2420 level.
Ripple recovered above the 23.6% Fib retracement level of the main decline from the $0.2503 high to $0.2379 low. However, the bulls failed to clear the $0.2450 resistance and the 100 hourly simple moving average.
Source: XRPUSD on TradingView.com
It was also rejected near the 50% Fib retracement level of the main decline from the $0.2503 high to $0.2379 low. As a result, there was a fresh decline below the $0.2420 level. There was also a break below a key contracting triangle with support at $0.2415 on the hourly chart of the XRP/USD pair.
The pair is now showing bearish signs and approaching the $0.2400 level. The next support is near the $0.2380 and $0.2375 levels. A clear break below the recent low could lead the price towards $0.2350 or even $0.2320 in the near term.
Chances of an Upside Break in XRP?
An initial resistance for ripple is near the $0.2420 level. The first key resistance is near the $0.2425 level and the 100 hourly simple moving average.
A successful break above the 100 hourly SMA and then a follow up move above the $0.2450 resistance might open the doors for a fresh increase in the near term. The next major resistance is near the $0.2500 level.
Technical Indicators
Hourly MACD – The MACD for XRP/USD is now gaining pace in the bearish zone.
Hourly RSI (Relative Strength Index) – The RSI for XRP/USD is currently well below the 50 level.
Major Support Levels – $0.2400, $0.2380 and $0.2350.
Major Resistance Levels – $0.2420, $0.2450 and $0.2500.
Source: https://www.newsbtc.com/analysis/xrp/ripple-xrp-crucial-breakdown-below-024/

