Bitcoin has seen another explosive move in the past 24 hours. As of the time of this article’s writing, the leading cryptocurrency has pressed higher to $11,800 for the first time in approximately a year.
This means that on the week, BTC has gained around 20%. And in the past day alone, Bitcoin has gained 4% — the best one-day performance since the rally from the $10,000s to $11,500 on Monday.
Bitcoin’s latest leg higher has been marked by an influx of liquidations of cryptocurrency margin platforms. According to Skew.com, a crypto derivatives portal, more than $5.3 million worth of BitMEX shorts have been liquidated in the past alone. This adds to the dozens of millions more that have been liquidated in the past 72 hours as BTC has shot higher.
Although some expect BTC to crack $12,000 in the hours ahead, an analyst has noted that Bitcoin has formed a textbook bear signal. But that’s not to say that it will undergo a correction.
Bitcoin Forms Textbook Reversal Signal
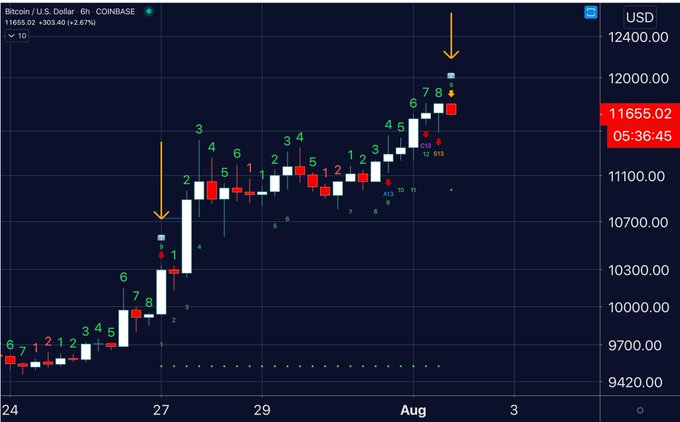
Bitcoin’s price action over the past day has been impressive but some technical indicators suggest that traders should still be cautious. One cryptocurrency trader shared the chart below minutes after BTC hit $11,800, writing:
“Double 9’s on the 6hr #bitcoin still early in the candle, could set up as perfected on the close.”
The trader is referencing how the Tom Demark Sequential (TD Sequential), a technical indicator that predicts inflection points in the trend of an asset, printed a potential reversal candle at the recent highs.
The TD Sequential forms “9” or “13” candles when an asset is likely at an inflection point. In the case of Bitcoin, as per the chart below, a correction is expected.
Chart of BTC's price action with TD Sequential overlay by trader "Big Chonis" (@BigChonis on Twitter). Chart from TradingView.com
While the TD Sequential is printing a signal of a potential reversal, the last time it formed a “9” on the six-hour chart, BTC only corrected for one candle, falling around 1.5%. As can be seen in the chart above, this happened on July 27th.
This historical precedent may suggest that BTC bulls may ignore the potential reversal signal.
Related Reading: Crypto Tidbits: Ethereum Surges 20%, US Banks Can Hold BTC, DeFi Still in Vogue
Most Indicators Remain Bullish
Corroborating the expectation that Bitcoin will ignore the TD Sequential “9,” other indicators and analysts remain optimistic about BTC’s short-term prospects.
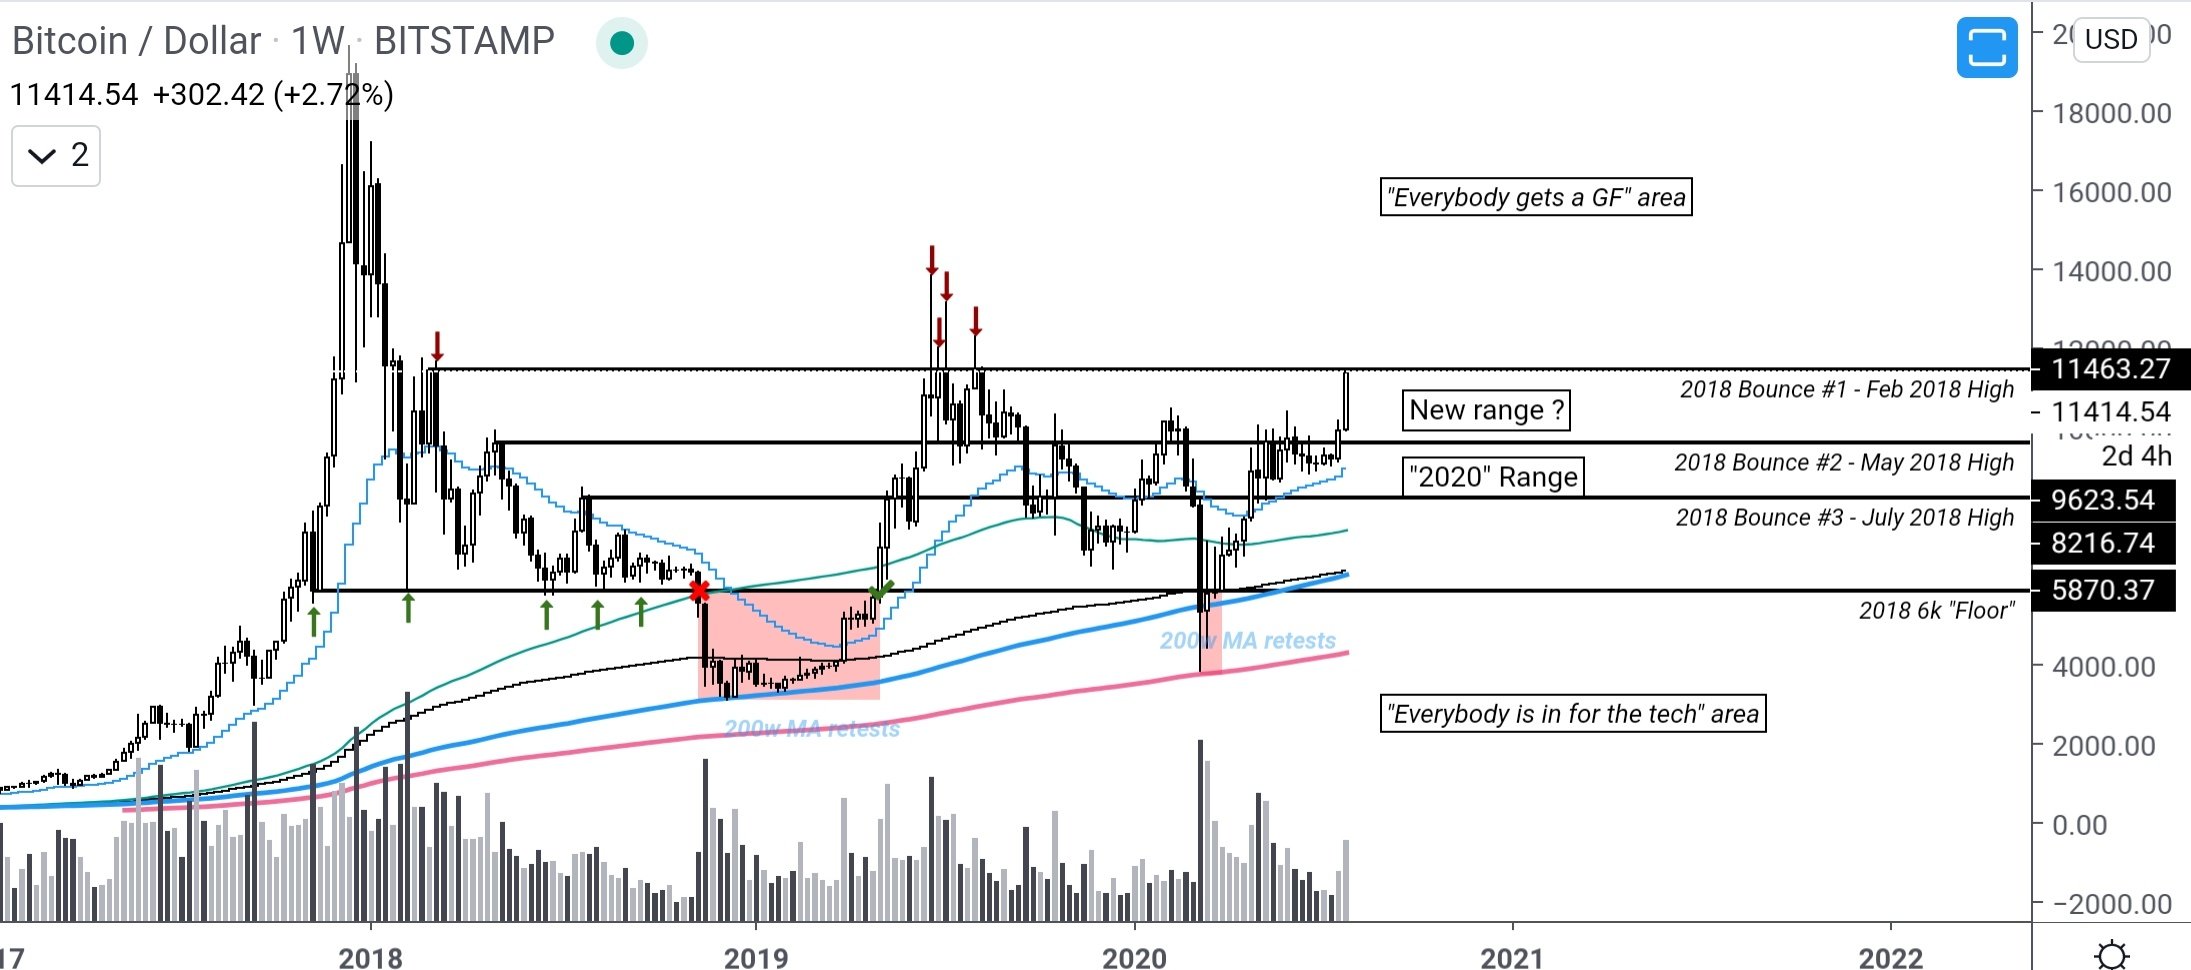
One trader commented that as long as Bitcoin holds above $11,500, the asset is primed to see further gains in the weeks ahead:
“Few hours to go before a massive monthly close. Few days to go to close the weekly above 11.5k.I personally wouldn’t have any problems with the Ear of maize hovering between 10k and 11.5k if that’s what needed for sustainable growth to ATH.”
Chart of BTC's macro price action from trader Pierre (@Pierre_crypt0 on Twitter). Chart from Tradingview.com
With funding rates still relatively low as well, BTC seems primed to continue its move to the upside.
FEatured Image from Shutterstock
Charts from TradingView.com
Price tags: xbtusd, btcusd, btcusdt
BTC Just Printed a Textbook Reversal Signal After Surging to $11,800


