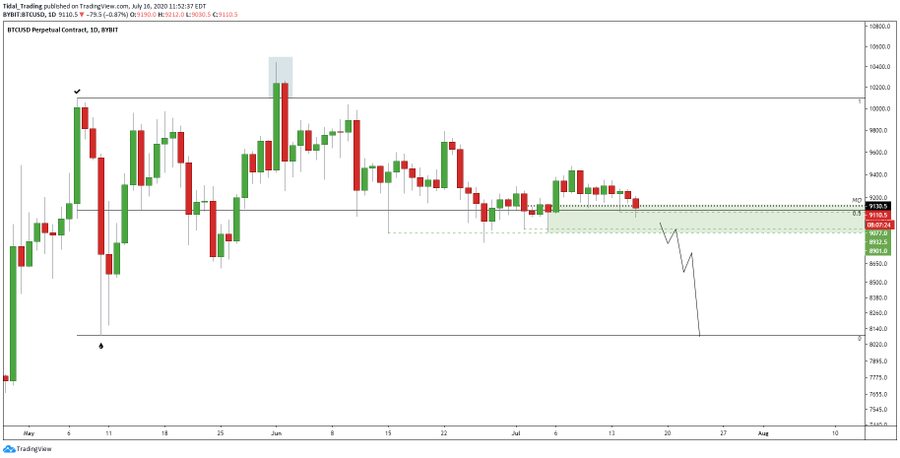
After holding $9,200 for days on end, Bitcoin has recently begun to break down. The cryptocurrency trades at $9,100 as of this article’s writing, having lost that short-term support.
Bitcoin’s ongoing weakness is seemingly related to bearish price action in global stock markets, including the S&P 500 index.
Following a -4.5% performance during the Shanghai Composite’s Thursday trading session that came in spite of positive economic data, North American stocks took a dive. As of this article’s writing, the S&P 500 is down by 0.5% while the Nasdaq 100 has taken a heavier beating due to the index having a tech-heavy basket.
As has been the “norm” over the past three to four months, Bitcoin has fallen in tandem with stocks.
While the S&P 500 is technically on solid footing because it is holding 3,200, analysts have said, the recent BTC weakness is scaring some market participants.
Related Reading: PSA: There’s A Crypto Scam on Youtube Misappropriating Cardano Content
Is It “Make or Break” For Bitcoin? An Analyst Thinks So
Bitcoin has yet to see a brutal breakdown that some cryptocurrency bears have been expecting.
Yet according to a Bitcoin trader, the leading digital asset is entering a “make or break” region that could mark the end of the short-term bull case if it’s lost:
“Make or break level here as price tests demand again, potentially sweeping a daily low. Remaining bullish as long as we can hold $8.9k on a daily closing basis. Now or never for #Bitcoin.”
His chart indicates that over the past few weeks, the zone between $8,800 and $9,100 has acted as a point for bullish bounces on multiple occasions.
Chart of BTC's price action over the past three months with analysis by trader "HornHairs" (@Cryptohornhairs on Twitter). Chart from TradingView.com
The importance of the prices around $8,800 has been echoed by Mohit Sorout, a founding partner at Bitcoin fund Bitazu Capital.
As reported by NewsBTC, Sorout suggested on July 15th that Bitcoin’s inability to hold $8,800 in the near future could stop the asset from rallying to $20,000 in 2020.
Related Reading: BTC Just Confirmed a Signal That Preceded Historical 5,000% Rallies
A Breakout Is Coming
Analysts are divided over if Bitcoin can hold this important “make or break” region. What many analysts aren’t divided over, though, is the sentiment that the cryptocurrency market will soon see a strong breakout.
As reported by NewsBTC, Bitcoin’s historical volatility has reached lows not seen since March 31st of 2019. What happened on April 1st was a 25% surge that kickstarted a rally from the $4,000s to $14,000.
Bitcoin Historical Volatility Index, one-day chart, BitMEX chart from "XC" (@Runtheirstops on Twitter). Chart from TradingView.com
Should history rhyme, the cryptocurrency market will soon see a breakout of macro proportions, likely catalyzing the next medium-term trend.
Featured Image from DepositPhotos
Price tags: xbtusd, btcusd, btcusdt
Charts from TradingView.com
It's "Make or Break" For Bitcoin as Bearish S&P 500 Drop Hammers BTC


