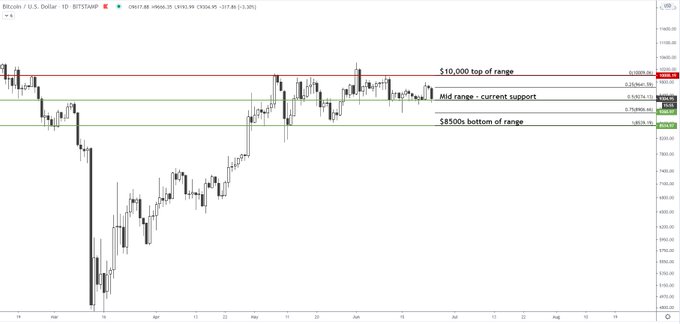
While Bitcoin has seen its fair share of short-term volatility, on a macro scale the cryptocurrency is still consolidating.
The below chart from Blockroots founder Josh Rager, a crypto trader, displays this well. The chart shows that over the past ~seven weeks, BTC has been effectively trapped between $8,500 and $10,000. Each breakout has failed to lead to a follow-through.
Chart of BTC’s price action over recent months by Josh Rager (@Josh_rager on Twitter). Chart from Tradingview.com
Yet the consolidation is reaching a breaking point: volatility indicators show that any day now, Bitcoin will finally move out of the range. And considering the length and magnitude of this consolidation, it could be “huge.”
Related Reading: A Hacker Just Drained $500k in Ethereum & Altcoins From a DeFi App
Bitcoin Could Soon See a Massive Move, Analysts Say
According to the analysts at Bitcoin Bravado, a crypto research group, a “huge” move in these markets is coming:
“BTC volatility is currently at historic lows as traders wait for a sign regarding where the next move is heading. […] Any time Bitcoin volatility gets this low, it usually means something huge is on the way. […] Suffice to say, the window for placing your bets is quickly narrowing.”
This is surely the case.
One trader shared the chart below late last week, showing Bitcoin’s price action since the start of 2019.
On the bottom of the chart is the Bollinger Bands Width indicator, which tracks the width of the bands. The Bollinger Bands is basically an advanced volatility indicator signaling important price points and when an asset is expected to move.
As can be seen, the width of the bands is reaching a level not seen since February of this year. That was just weeks prior to Bitcoin dropping by 60% in literally half a month.
Bitcoin price chart over the past one and a half years with volatility indicator (Bollinger Band Width). Chart from TradingView.com; shared by Byzantine General (@Byzgeneral on Twitter).
Institutional Traders Are Betting on Downside
With Bitcoin primed to see a massive move, investors have begun to stack their chips to try to capitalize on the impending move.
According to CME futures data, institutions have been building a net short position throughout this consolidation.
One trader recently shared the image below, which shows that entities deemed “institutional traders” are cumulatively shorting 2,038 of the CME’s BTC futures contracts.
Bitcoin price chart with CME's Commitment of Traders report data. Chart from TradingView.com; made by Byzantine General (@Byzgeneral on Twitter).
This is notable as this group of traders has historically predicted downswings.
For instance, near the top of February’s rally, institutional traders started to build a Bitcoin short position via the CME. And prior to the launch of Bakkt, this group did the same.
Featured Image from Shutterstock
Price tags: xbtusd, btcusd, btcusdt
Charts from TradingView.com
A "Huge" Bitcoin Move Is Imminent as Price Stalls in the Low-$9,000s


