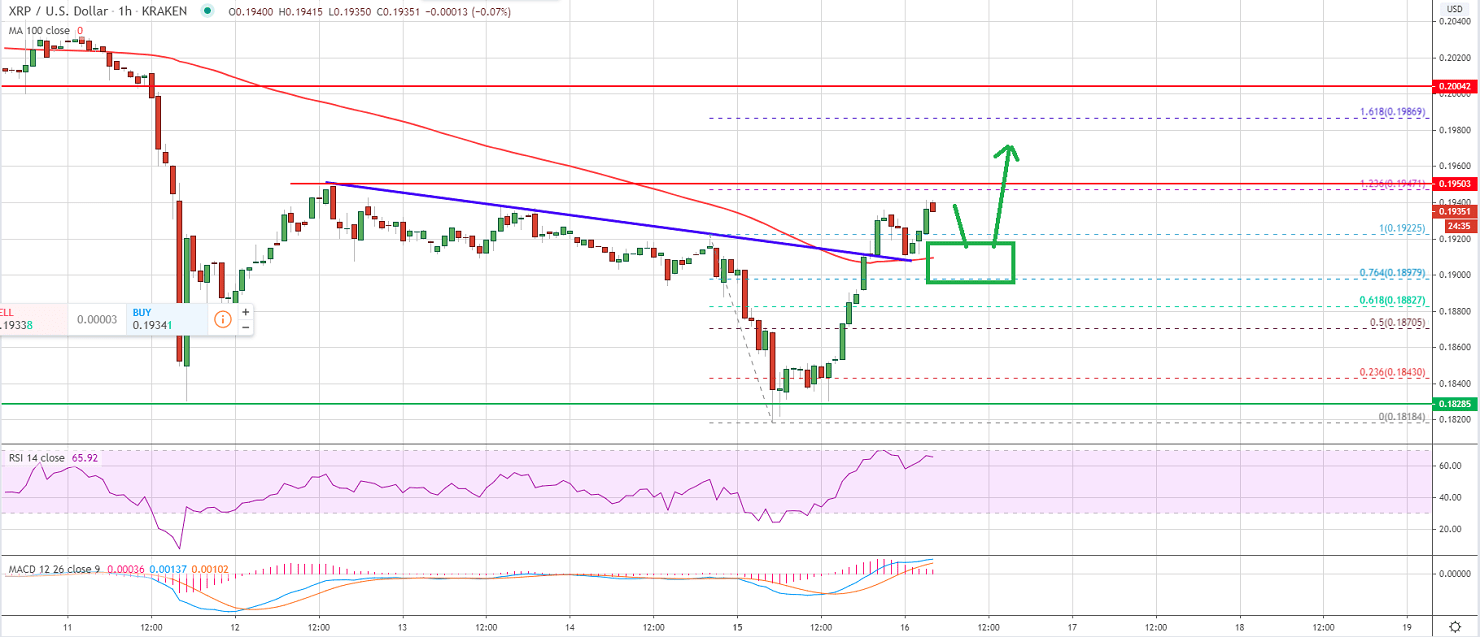
Ripple started a strong increase from the $0.1820 support zone against the US Dollar. XRP price seems to have formed a double bottom pattern and it could rise further towards $0.2000.
- Ripple is up more than 4% and it is now trading above $0.1900 against the US dollar.
- A double bottom pattern is likely forming near the $0.1820 support zone.
- There was a break above a key bearish trend line with resistance near $0.1910 on the hourly chart of the XRP/USD pair (data source from Kraken).
- The pair is likely to break the $0.1950 resistance to continue higher.
Ripple Price Recovers 4%
Ripple price extended its decline below the $0.1880 support level, but it remained stable above the $0.1825 support. XRP seems to have formed a double bottom pattern near the $0.1820 level.
Recently, there was a sharp recovery wave in bitcoin and ripple above $9,400 and $0.1900 respectively. XRP managed to clear many key hurdles near the $0.1900 level and the 100 hourly simple moving average to move into a positive zone.
The bulls pushed the price above the 76.4% Fib retracement level of the downward move from the $0.1922 high to $0.1818 low. There was also a break above a key bearish trend line with resistance near $0.1910 on the hourly chart of the XRP/USD pair.

The pair is now trading above the $0.1922 high and it is likely to test the $0.1950 resistance. It coincides with the 1.236 Fib extension level of the downward move from the $0.1922 high to $0.1818 low.
If ripple surpasses the $0.1950 resistance, it is likely to test the $0.2000 resistance zone to complete the double bottom pattern. Any further gains could lead the price towards the $0.2020 resistance zone in the near term.
Fresh Decline in XRP?
The $0.1950 level is a major hurdle for ripple, followed by the $0.2000 pivot level. Therefore, there are chances of a bearish reaction from $0.1950 or $0.2000.
On the downside, an initial support is near the $0.1900 level and the 100 hourly SMA. The main support is at $0.1888, below which the price is likely to resume its decline.
Technical Indicators
Hourly MACD – The MACD for XRP/USD is now gaining pace in the bullish zone.
Hourly RSI (Relative Strength Index) – The RSI for XRP/USD is now well above the 50 level.
Major Support Levels – $0.1900, $0.1880 and $0.1820.
Major Resistance Levels – $0.1950, $0.2000 and $0.2020.
Take advantage of the trading opportunities with Plus500
Risk disclaimer: 76.4% of retail CFD accounts lose money.
