Earlier this week, Bitcoin sustained a heavy drop.
The cryptocurrency, just 24 hours after attempting a $10,000 break, plunged nearly $1,000 in the span of 12 hours. The move brought the cryptocurrency from around $10,030 to $9,050 (most major exchanges).
Analysts are divided over what technical damage the drop caused.
Some say that it is to be expected, calling the drop a part of a wider consolidation pattern that Bitcoin will break higher from. Others say that it cements the sentiment that the bull trend formed after March’s $3,700 lows is decisively over.
A key technical indicator recently confirmed the bearish sentiment.
Related Reading: Crypto Tidbits: Bitcoin Fails at $10k, Ethereum Coins Explode, Coinbase Looks to Add 18 Altcoins
Bitcoin Falls Below Crucial Moving Average, Hurting Bull Case
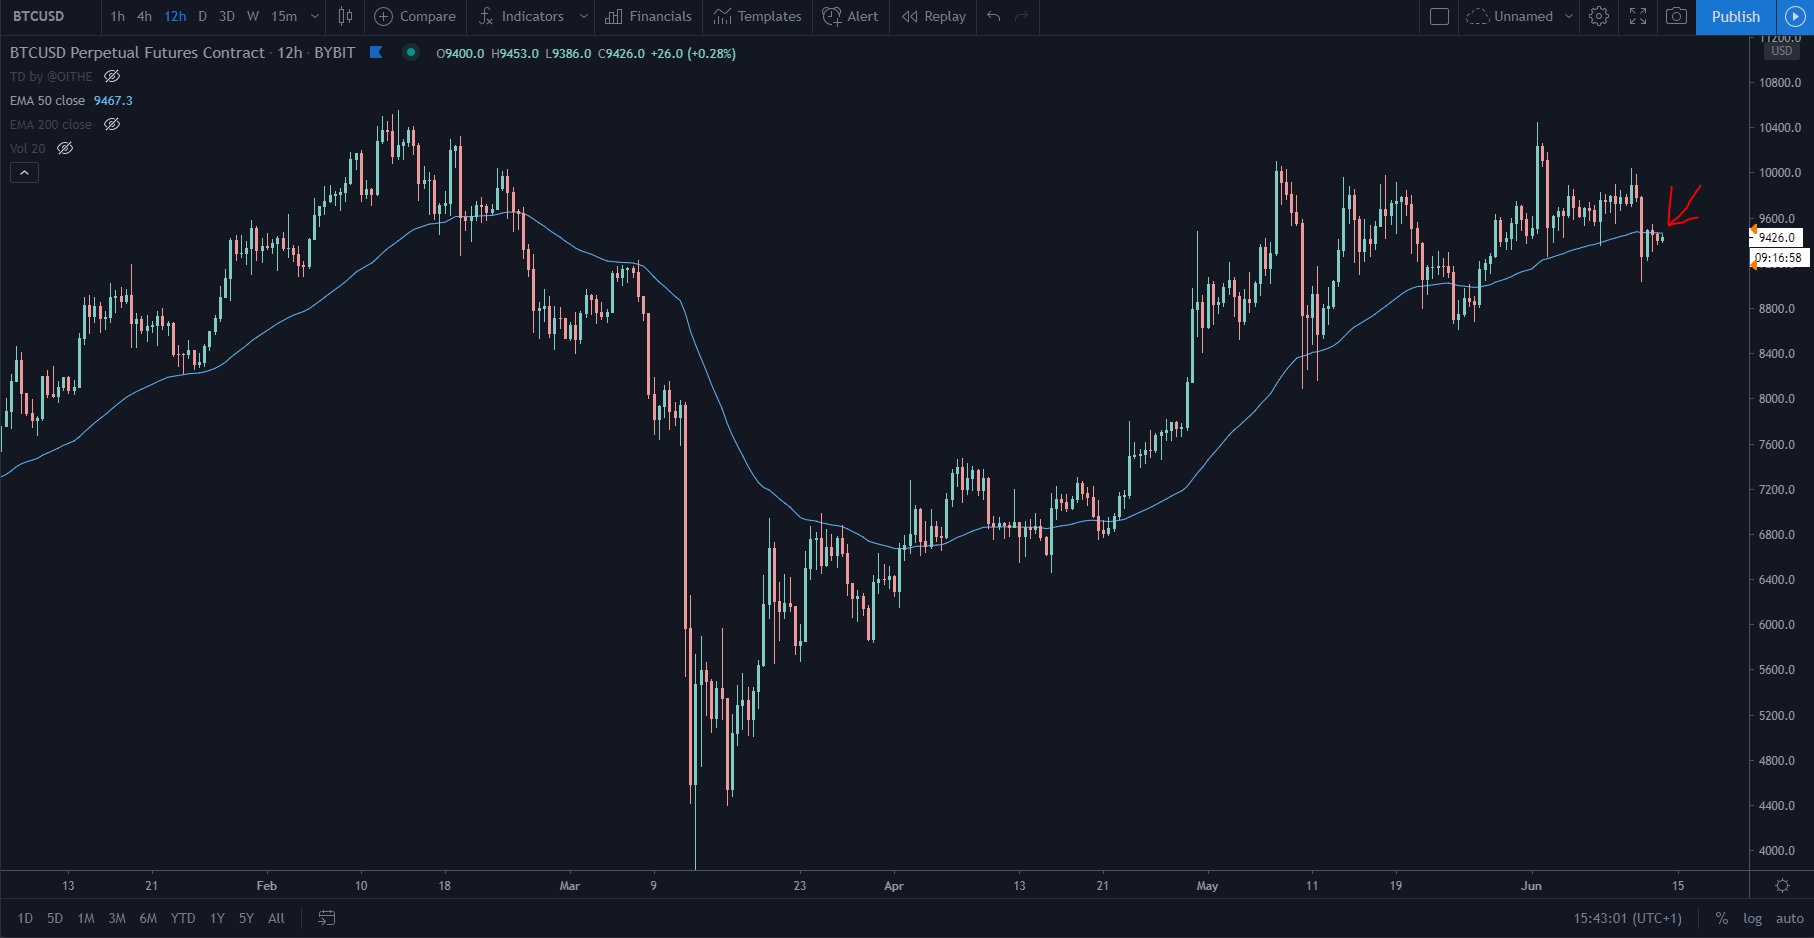
The recent $1,000 drop, despite the $500 recovery afterward, has brought Bitcoin below a crucial technical level: the 50-day exponential moving average.
A cryptocurrency trader shared the chart below, which shows Bitcoin’s price in relation to the 50-day exponential moving average since the start of the year. The comment attached to the chart is “does this EMA control the price of Bitcoin?”
As depicted, the level has been extremely important to BTC’s trends since the start of 2020. During the bull rally in April and May, it acted as a point at which Bitcoin bounced.
And in late February and early March, Bitcoin slid below the technical level before plunging to $3,700 just weeks later.
This historical precedent suggests that Bitcoin could plunge lower in the coming weeks, likely towards supports in the low-$8,000s or even in the $6,000s.
The analyst that shared the chart above is far from the only cryptocurrency trader to seemingly be forecasting a strong decline.
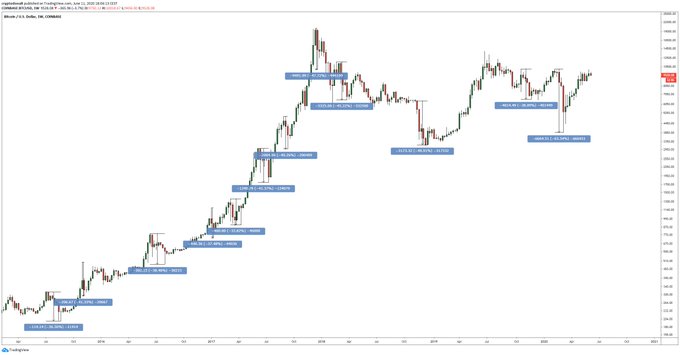
“I’ve been seeing more and more comments saying BTC going down to support is unlikely because that’d be too big a drop. That’s not how Bitcoin works. Retraces are short and vicious. Crashes even more so. 40% down is not unlikely, it’s happened before, it’ll happen again.”
Stocks Are Rolling Over Too
Boosting the expectations of downside in the cryptocurrency market, stocks seem to be rolling over as well.
Despite the strong 1.5% bounce seen on Friday, Thursday’s trading session was one of the worst days for the equity markets ever. The Dow Jones moved close to the circuit breaker of 7% down.
The drop came on fears that the pandemic is going to see a second wave, along with bearish projections from the monetary and economic authorities of the world.
For instance, the Federal Reserve is charting a more-than 6% annual GDP drop, which would be one of the worst declines on record. The World Bank is predicting a global GDP decline of around 5%.
Should the move lower in stock prices continue, Bitcoin could suffer, which would line up with the technical analyses conveyed in the first part of this article.
As BitMEX’s Arthur Hayes once explained:
“Bitcoin will be owned unlevered. Could the price retest $3,000? Absolutely. As the SPX rolls over and tests 2,000 expect all asset classes to puke again.”
Related Reading: Last Time Bitcoin Saw This Structure, It Surged 40%. It’s About to Happen Again
Featured Image from Shutterstock
Price tags: xbtusd, btcusd, btcusdt
Indicator That "Controls" Bitcoin Forms a Signal Seen Before March's 50% Crash


