It’s been a volatile past few weeks for Bitcoin.
Last week, the cryptocurrency traded within a $2,000 range, rallying as high as $10,400 before plunging to $8,600 in a massive liquidation event that wiped out over $100 million worth of positions.
On a smaller scale, Bitcoin has seen rapid $100-300 swings multiple times a day over the past two weeks.
Analysts have had mixed feelings about this price action.
Some argue that since BTC was rejected at $10,400, the cryptocurrency is poised to drop lower. $10,500 has been a pivotal level for Bitcoin over the past year, acting as a reversal point for two key rallies, one in October and one in February.
Yet analysts say that the price action over the past few weeks looks eerily similar to Bitcoin in March 2019, prior to a vertical breakout that brought the asset to $14,000.
Related Reading: Crypto Tidbits: $200M of Bitcoin Liquidated, Ethereum DeFi Adoption Limited, Bloomberg Is Bullish
Bitcoin Is Poised to Erupt Higher, Fractal Analysis Shows
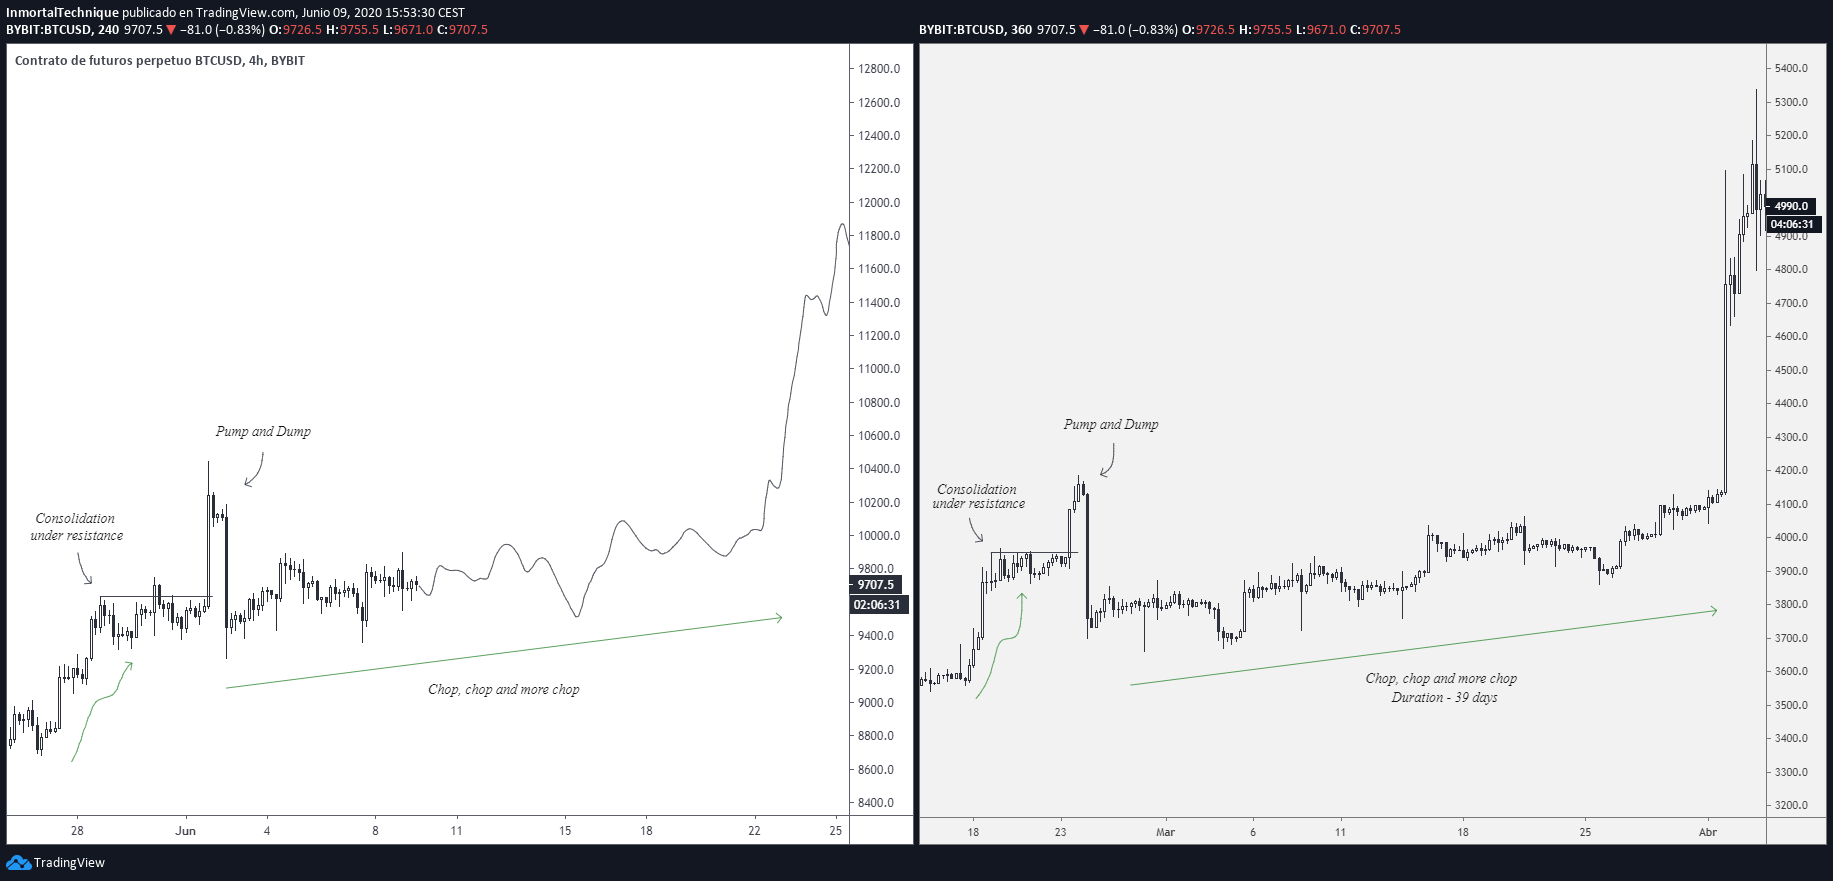
Bitcoin’s recent price action, including the $10,400 rejection, looks eerily similar to the price action seen in February and March of 2019. What followed March of 2019 was a rally that took the asset approximately 250% higher in three months.
“I think I’ve seen this before,” an analyst remarked in reference to the two charts before. This fractal analysis predicts that BTC will hit $12,000 by the end of the month.
Another analyst echoed the assertion that Bitcoin’s recent price action looks similar to the pattern pre-breakout in March 2019. He remarked on the matter:
“This is turning in the EXACT same as March 2019, a VERY slow grind up, non volatile, everyone switching bias over 50$ moves, market seems dead But in the end, the nukes get weaker and weaker, and the pressure increases. “
Traders Are Expecting Upside
Traders in the crypto space are expecting a move to the upside.
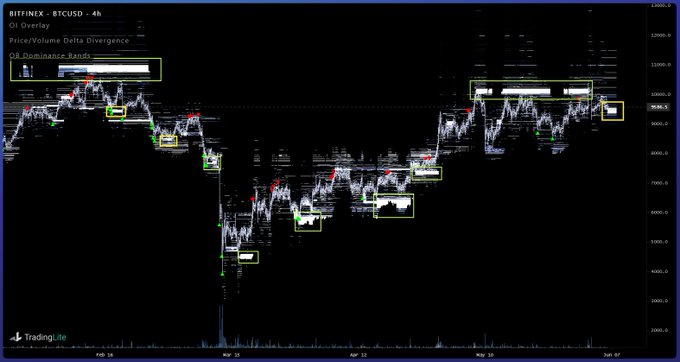
As reported by NewsBTC previously, Bitfinex’s order book showed last week that there is a clear confluence of buying pressure in the $9,500 range.
This is important as the last time there was such buy support on Bitfinex was when Bitcoin was trading in the $7,000s. Order book data also called numerous trend tops over the past four months.
Other signs show that the average crypto trader is positioning for upside.
Crypto derivatives publication Ecoinometrics noted that there is now $300 million worth of open interest in the CME’s Bitcoin call options market.
Call options are derivatives that allow the buyer of the contract to buy an asset at a specific price during a specified time span. Call options are often used by investors that want to financially gain from an asset appreciation in value.
Related Reading: Over a Dozen Top Crypto Assets Are Up Over 10% Today: Here’s Why
Featured Image from Shutterstock
Price tags: xbtusd, btcusd, btcusdt
Title: Last Time Bitcoin Had This Market Structure, It Rallied 250% in Three Months


