- Ethereum is trading above the key $145 and $146 support levels against the US Dollar.
- The price is likely to surpass the $150 and $152 resistance levels in the near term.
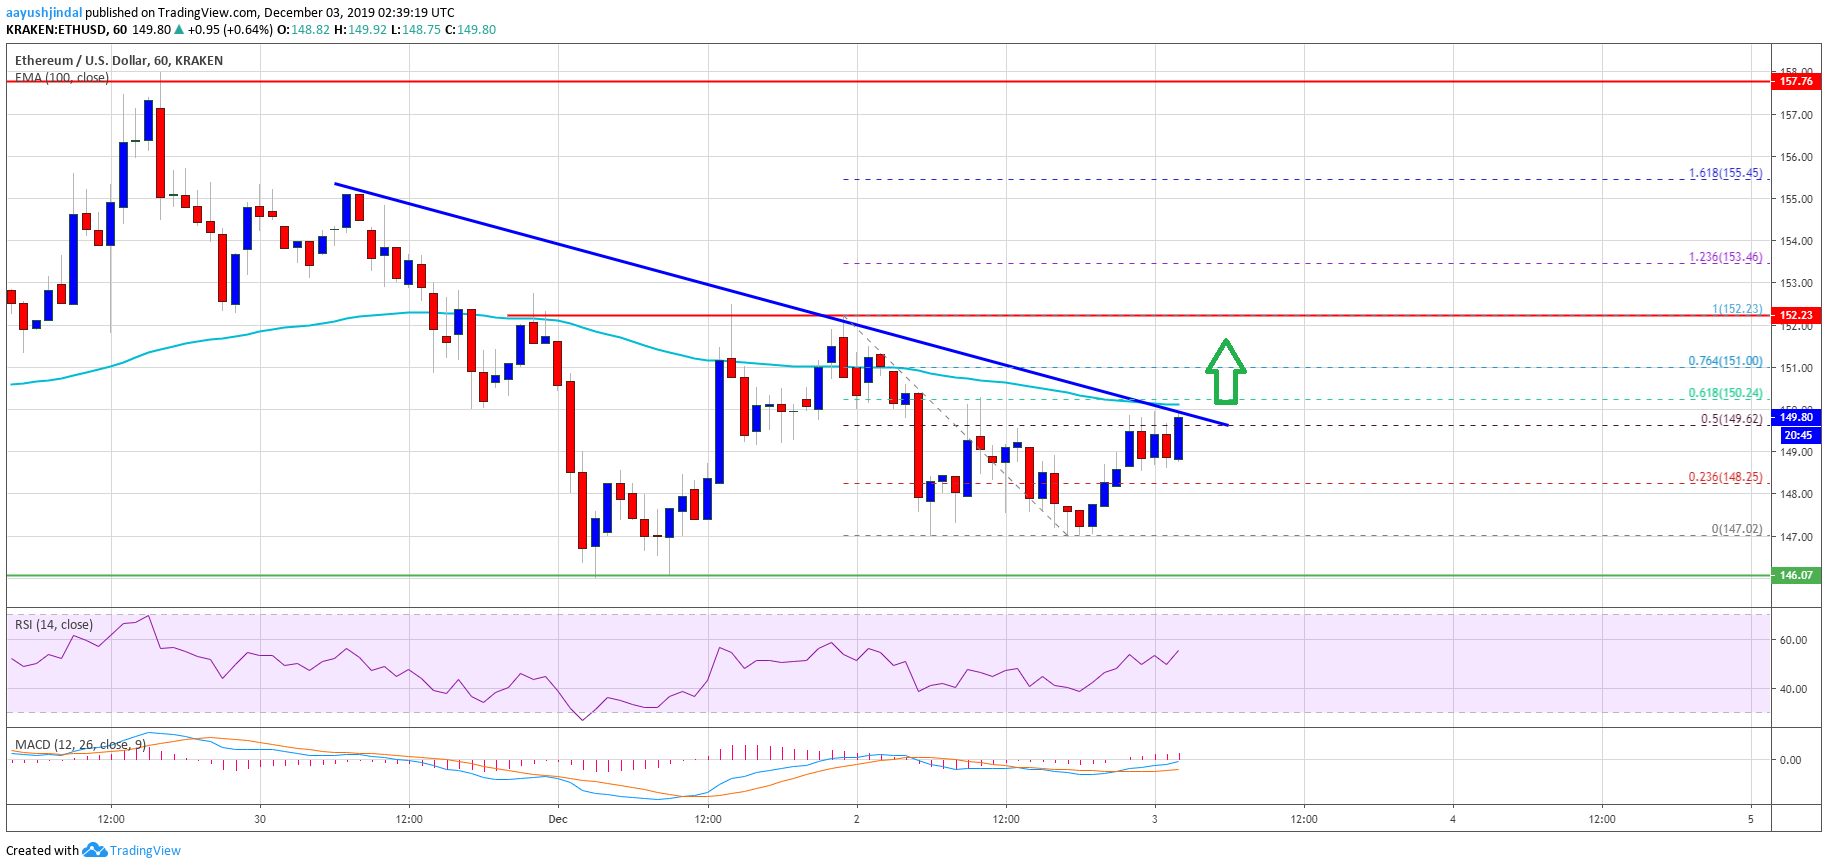
- There is a new connecting bearish trend line forming with resistance near $150 on the hourly chart of ETH/USD (data feed via Kraken).
- The price is likely to accelerate higher once it clears the $152 resistance zone.
Ethereum price is holding a couple of key supports versus the US Dollar and bitcoin. ETH price is likely to climb above $152 as long as it is above $146.
Ethereum Price Analysis
Recently, we saw a fresh decrease in Ethereum after it failed to climb above the $158 resistance area against the US Dollar. ETH price traded below the $150 support area and the 100 hourly simple moving average.
However, the $145 and $146 levels provided support. A swing low was formed near $146 and the price started correcting recent losses. It recovered above the $150 level, but it struggled to clear the $152 resistance.
Finally, there was another test of the $146 support and the price is currently consolidating in a range. Moreover, the price is trading above the 23.6% Fib retracement level of the recent decline from the $152 high to $147 low.
An immediate resistance is near the $150 level and the 100 hourly simple moving average. Besides, there is a new connecting bearish trend line forming with resistance near $150 on the hourly chart of ETH/USD.
The 50% Fib retracement level of the recent decline from the $152 high to $147 low is also near the trend line resistance. If there is a clear break above the $150 resistance, Ethereum price could continue to rise.
Therefore, a break above the trend line and the 100 hourly simple moving average could push the price towards the $152 resistance levels. If the bulls gain pace above the $152 resistance, the price is likely to accelerate higher.
The next key resistances are near the $158 and $160 levels. Conversely, the price could struggle to continue above $150 and $150 resistances. In the mentioned case, it may perhaps retest the $146 support.
Looking at the chart, Ethereum price is clearly trading near a couple of key hurdles such as $150 and $152. Thus, it could either rally above $152 or attempt a downside break below the $146 support area. The next major support is near the $142 level.
ETH Technical Indicators
Hourly MACD – The MACD for ETH/USD is slowly moving in the bullish zone.
Hourly RSI – The RSI for ETH/USD is currently above the 50 level, with a bullish angle.
Major Support Level – $146
Major Resistance Level – $152
The post Ethereum (ETH) Holding Uptrend Support, Bitcoin Recovering appeared first on NewsBTC.
Source: https://www.newsbtc.com/2019/12/03/ethereum-eth-holding-support-bitcoin-recovering/

