- Ethereum is showing positive signs above the $150 and $152 resistance levels against the US Dollar.
- The price is currently trading near the $155 resistance and it could rise further.
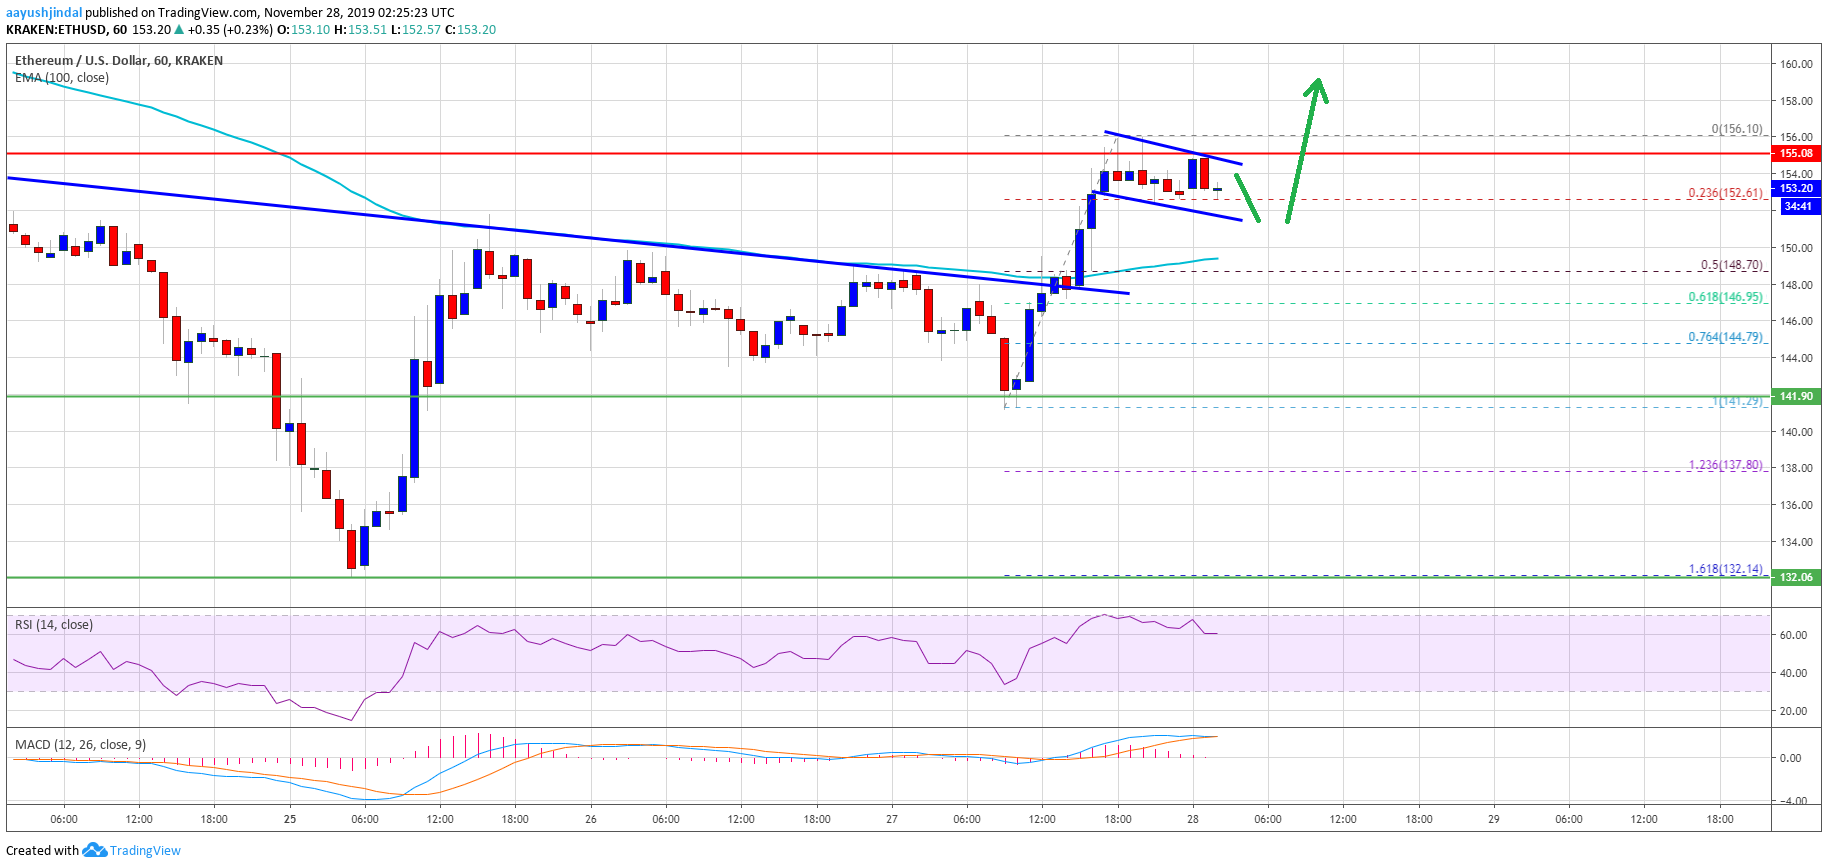
- There is a short term bullish flag forming with resistance near $155 on the hourly chart of ETH/USD (data feed via Kraken).
- The price could rise nicely above the $155 and $160 resistance levels in the near term.
Ethereum price is gaining bullish momentum above $150 versus the US Dollar, while bitcoin rallied above $7,500. ETH price is likely to aim $165 if it settles above $155.
Ethereum Price Analysis
Recently, there was a nice recovery in Ethereum above the $140 and $142 resistance levels against the US Dollar. Later, ETH price consolidated above the $142 support area and below the 100 hourly simple moving average.
Finally, the bulls gained strength and were able to push the price above the $150 resistance area and the 100 hourly simple moving average. Besides, yesterday’s key bearish trend line with resistance near $150 was breached on the hourly chart of ETH/USD.
It opened the doors for more gains above the $152 resistance. Ethereum tested the $155-$156 resistance area and it is currently consolidating gains. An initial support is near the $152 level.
Furthermore, the 23.6% Fib retracement level of the recent rise from the $142 swing low to $156 high is also near the $152 level. More importantly, there is a short term bullish flag forming with resistance near $155 on the same chart.
If there is an upside break above $155 and the price climbs above the $156 high, there could be more gains. In the mentioned case, the price may perhaps surpass the $160 resistance and continue higher.
The next key resistance of the target for the current recovery could be $165. Conversely, the price might fail to continue above the $155 and $156 resistance levels.
On the downside, the price may revisit the $148 zone if it breaks the $152 support. The 50% Fib retracement level of the recent rise from the $142 swing low to $156 high is also near the $148 level. If there are more downsides below $148 and the 100 hourly SMA, the price will most likely retest the $142 support.
Looking at the chart, Ethereum price is showing positive signs above the $152 and $148 support levels. The current price action suggests high chances of more gains above $155 and $158.
ETH Technical Indicators
Hourly MACD – The MACD for ETH/USD is slowly losing pace in the bullish zone.
Hourly RSI – The RSI for ETH/USD is currently correcting lower from 65 and it could test the 50 level.
Major Support Level – $148
Major Resistance Level – $155
The post Ethereum (ETH) Signaling Upside Continuation, $165 Possible? appeared first on NewsBTC.
Source: https://www.newsbtc.com/2019/11/28/ethereum-eth-signaling-upside-continuation-165-possible/

