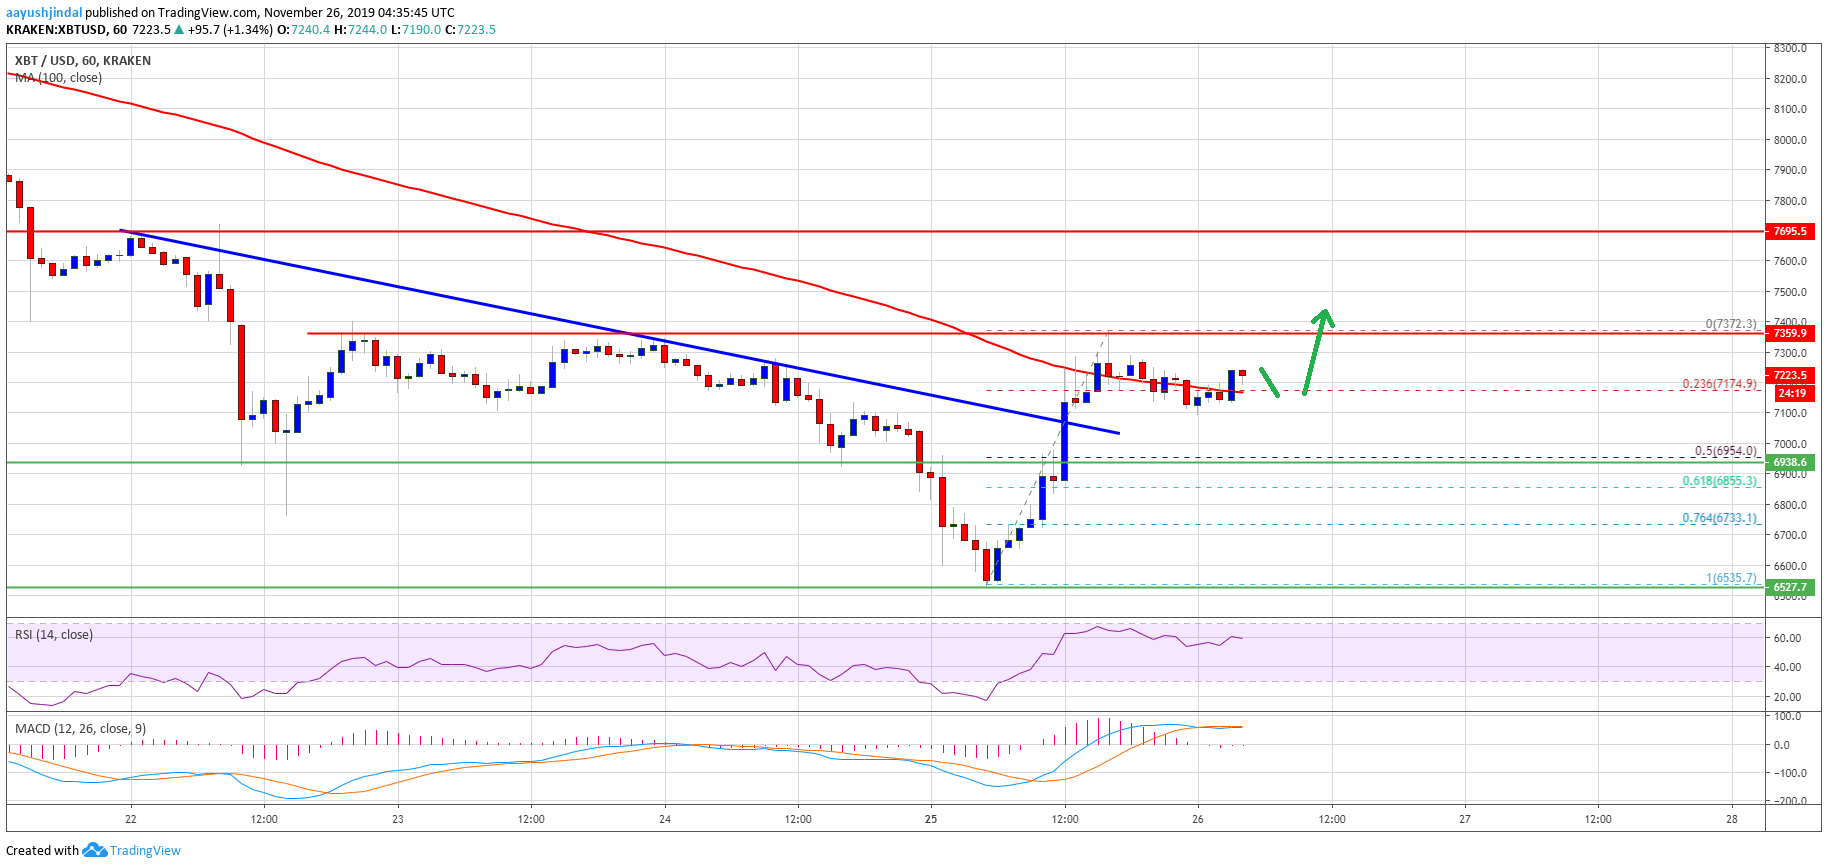
- Bitcoin price tested the crucial $6,500 support area and started an upside correction against the US Dollar.
- The price is up around 10% and it even settled above the $7,000 resistance area.
- Yesterday’s key bearish trend line was breached with resistance near $7,060 on the hourly chart of the BTC/USD pair (data feed from Kraken).
- The bulls are now facing a couple of important downtrend resistances near $7,350 and $7,700.
Bitcoin price is showing a few positive signs above $7,000 against the US Dollar. However, the bear run might not end until BTC climbs back above $7,700.
Bitcoin Price Analysis
Earlier this month, we discussed the chances of bitcoin hitting $7,400 and $6,500 against the US Dollar. BTC did decline heavily and recently tested the main $6,500 support area.
A new multi-month low was formed near $6,535 before the price started an upside correction. There was a strong recovery after the price surpassed the $6,750 resistance area. Besides, the price rallied more than 10% to climb above the $7,000 resistance.
More importantly, yesterday’s key bearish trend line was breached with resistance near $7,060 on the hourly chart of the BTC/USD pair. The pair even spiked above the 100 hourly simple moving average and tested the $7,350 resistance area.
A high was formed near $7,372 and bitcoin price is currently trimming gains. It traded below the $7,200 level. Additionally, there was a break below the 23.6% Fib retracement level of the recent wave from the $6,535 low to $7,372 high.
At the moment, the price is consolidating near the $7,200 level and the 100 hourly simple moving average. On the upside, the first key resistance is near the $7,350 and $7,375 levels.
Should bitcoin price climbs above $7,375, the next downtrend resistance is near the $7,700 level. A successful close above the $7,700 level might push the price back into a positive zone.
Conversely, the price could struggle to continue above $7,375. In the mentioned case, the price is likely to retest the $7,000 support area. The 50% Fib retracement level of the recent wave from the $6,535 low to $7,372 high is also near the $6,950 level to provide support.
Looking at the chart, bitcoin price is showing a few bullish signs above $7,200, but the bulls need to gain momentum above the $7,350 and $7,375 resistance levels. On the other hand, a close below $6,950 might restart the downtrend.
Technical indicators:
Hourly MACD – The MACD is about to move back into the bearish zone.
Hourly RSI (Relative Strength Index) – The RSI for BTC/USD is currently well above the 50 level.
Major Support Levels – $7,000 followed by $6,950.
Major Resistance Levels – $7,375, $7,500 and $7,700.
The post Bitcoin (BTC) Price Bear Run Has Come To End? appeared first on NewsBTC.
Source: https://www.newsbtc.com/2019/11/26/bitcoin-btc-price-bear-run-has-come-to-end/

