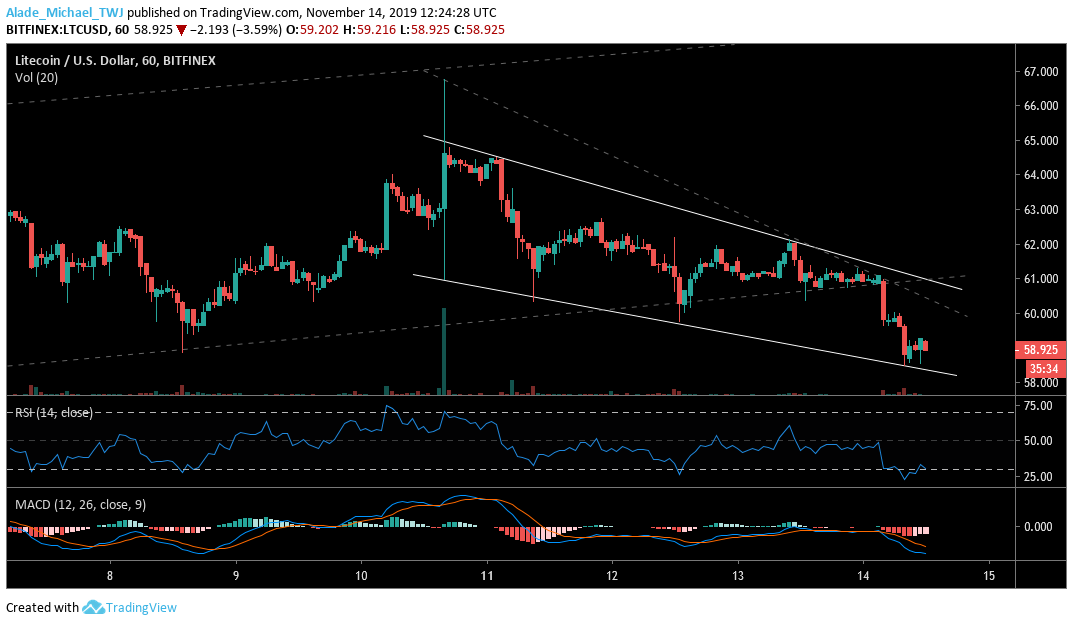
- LTC broke out of a channel to a new descending wedge after dropping below $61 price levels earlier today.
- The price rejection at $66 price levels has made Litecoin stay under a bearish pressure since the weekly opening.
- Litecoin may gain bullish momentum if the price can reclaim $61, which appeared to be a critical confluence zone for the market.
Litecoin has witnessed a lot of price reductions over the past three days due to a significant correction which is making the bears gain control of the market.
However, a bullish step back is expected for LTC, once it climbs back above $60 price level, although the $61 resistance is an essential level for the next bullish phase on the hourly chart.
Litecoin (LTC) Price Analysis
Following November 10, rejection at $66, Litecoin has remained in a downward range. The latest bearish scenario has caused LTC to trade inside a descending wedge, but the price is now sitting on the lower boundary of the wedge.
Therefore, a retracement could be underway to the upper boundary of the wedge at $60. A break above the wedge could allow the bulls to regain control of the market. This could bring the next resistance levels at $62, followed by a decent rally to $64.6 resistance levels.
Litecoin is currently holding near support at $58. This support could become weak if we continue to witness a devastating price drop.
However, we may need to keep an eye on the $57 and $56 supports in the next swing low. Additionally, Litecoin is still showing a bullish sign on the daily chart.
Litecoin to Enter the Bullish Trend
The market structure looks bullish on the higher time frame, but, the lower time frame is currently suggesting a bearish mode for Litecoin.
Meanwhile, the last three days’ downward direction is just a sign of a small pullback on the daily chart. We can expect a bullish continuation in the next couple of days. Otherwise, we may continue to see a decline until Litecoin finds vital support for a rebound.

Source: Tradingview
Technical Indicator Reading:
Hourly RSI (Relative Strength Index) – The RSI for Litecoin has dropped to the extremely oversold region but has recovered a bit to the 30 levels.
Hourly MACD (Moving Average Convergence and Divergence) – The MACD for Litecoin is currently negative to show a bearish momentum
Key resistance levels: $60, $62, $64.6
Key support levels: $58, $57, $56
The post Litecoin Correction Causes Serious Bearish Action, Why Further Pullback is Likely appeared first on NewsBTC.
