- Ethereum price struggled to climb above the $185 resistance and declined recently against the US Dollar.
- Bitcoin price is also facing selling interest and it is now trading below the $8,200 support area.
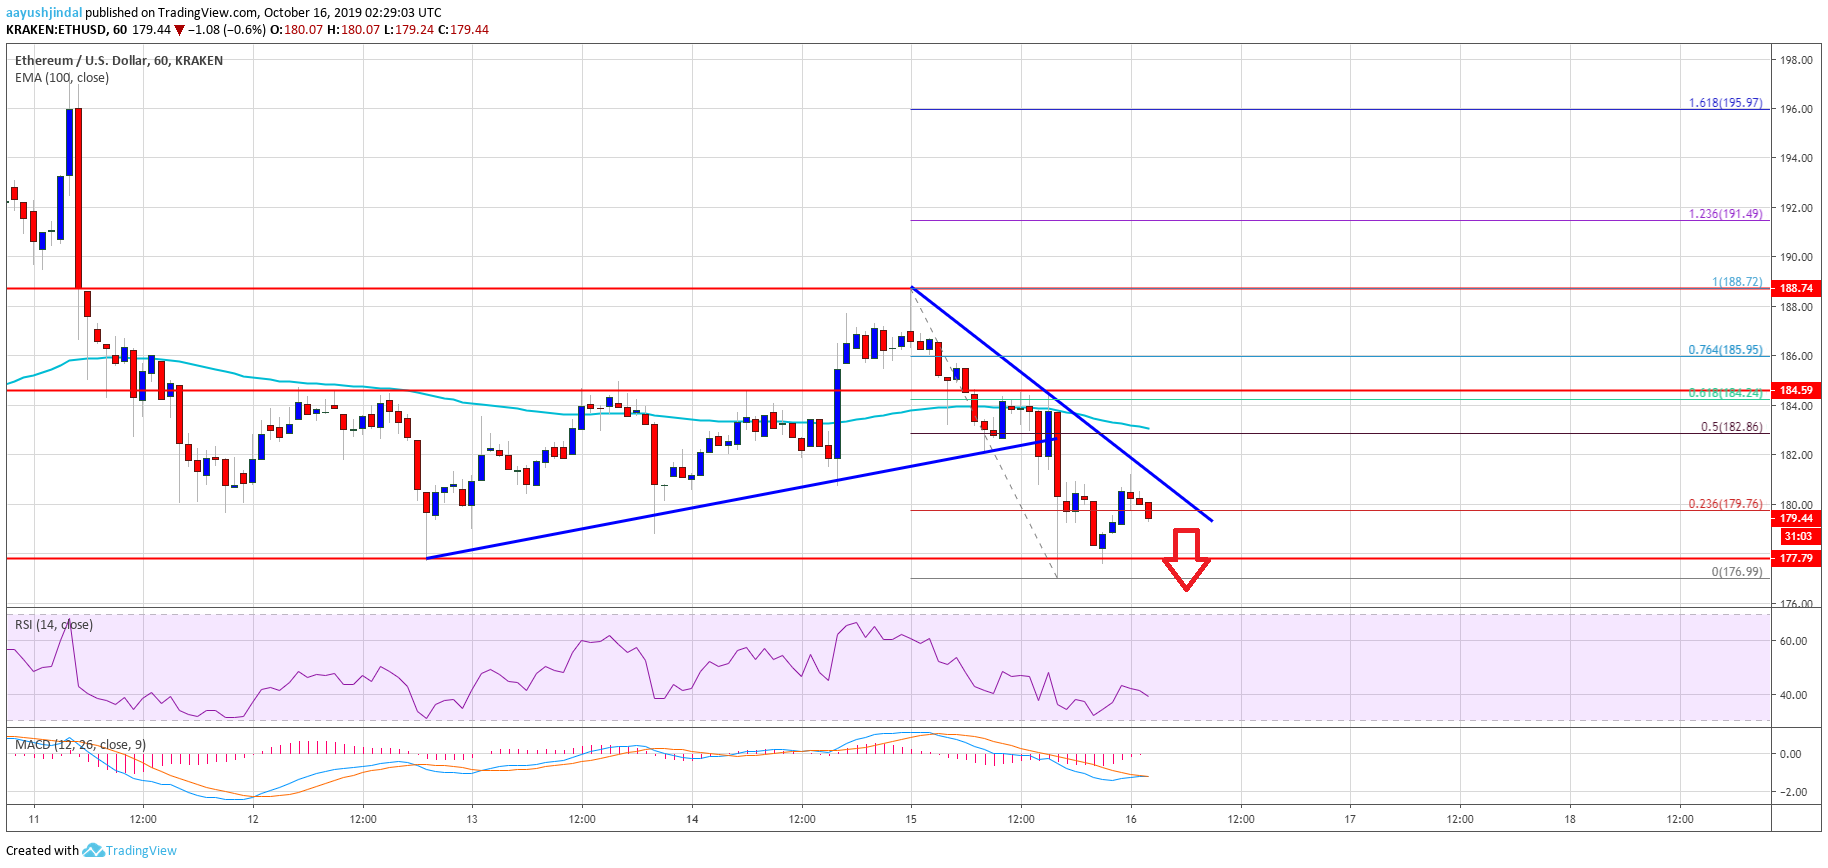
- There is a new connecting bearish trend line forming with resistance near $181 on the hourly chart of ETH/USD (data feed via Kraken).
- The pair is likely to decline further below $175 as long as it is trading below the $185 resistance.
Ethereum price is struggling to climb higher versus the US Dollar, similar to bitcoin. Therefore, ETH price could decline below the $175 support in the near term.
Ethereum Price Analysis
Yesterday, Ethereum tested the $188 resistance area against the US Dollar. However, it struggled to continue higher, resulting in a fresh decline below the $185 level. The stated $185 level later acted as a resistance. ETH price extended its decline below the $180 level and it also settled below the 100 hourly simple moving average. The price even broke the $178 support area and traded to a new weekly low near $177.
A swing low was formed near $177 and the price is currently consolidating losses. It corrected a few points above the $178 level. Moreover, the price tested the 23.6% Fib retracement level of the recent decline from the $188 high to $177 swing low. However, the $180-$182 zone seems to be acting as a resistance for the bulls. More importantly, there is a new connecting bearish trend line forming with resistance near $181 on the hourly chart of ETH/USD.
Above the trend line, the $183 level might act as a resistance since it coincides with the 100 hourly SMA. Moreover, the 50% Fib retracement level of the recent decline from the $188 high to $177 swing low is also near the $183 level. The main resistance on the upside for Ethereum bulls is near the $185 level, above which it could revisit the $188 resistance.
Conversely, if there is no upside break above the $185 resistance, the price could continue to decline. The main supports are near $178 and $175. A successful close below the $175 support could start a strong decline in the near term.
Looking at the chart, Ethereum price is clearly struggling to gain bullish momentum above $185 and $188. Besides, there are many hurdles on the upside near the $192 and $195 levels. Therefore, the price could react to the downside unless the bulls clear the $185 resistance.
ETH Technical Indicators
Hourly MACD – The MACD for ETH/USD is struggling to move into the bullish zone.
Hourly RSI – The RSI for ETH/USD is currently below the 50 level, with a bearish angle.
Major Support Level – $175
Major Resistance Level – $185
The post Ethereum (ETH) At Risk Of More Downsides Below $175 appeared first on NewsBTC.
Source: https://www.newsbtc.com/2019/10/16/ethereum-eth-at-risk-of-more-downsides-below-175/

