When asked about the drawbacks of Bitcoin, many people cite the cryptocurrency market’s immense volatility — multiple days a year, BTC and its ilk have 10%+ days.
Case in point, the Bitcoin price tumbled off a cliff in late September, falling from the lofty price point of $10,100 to $7,700 in a week’s time. This move, as made evident by over $500 million in BitMEX long position liquidations in an hour, caught many investors were their pants down.
Related Reading: Does Crypto Need a Bitcoin ETF? CNBC Analyst Says Maybe Not
But Bitcoin’s price action in this scenario may not be as random as it seems. In fact, some have argued that the chart structure formed after the precipitous drop shows that bears are running out of steam. And quick.
Bitcoin Bottoming Fractal Gains Credence
If you’ve perused Crypto Twitter at all over the past week or two, you likely would have noticed the incessant mentions of a Bitcoin price fractal.
(A fractal, in the context of financial assets and their respective charts, is a certain historical chart formation/price action repeating on a smaller scale at a different time or for a different asset.)
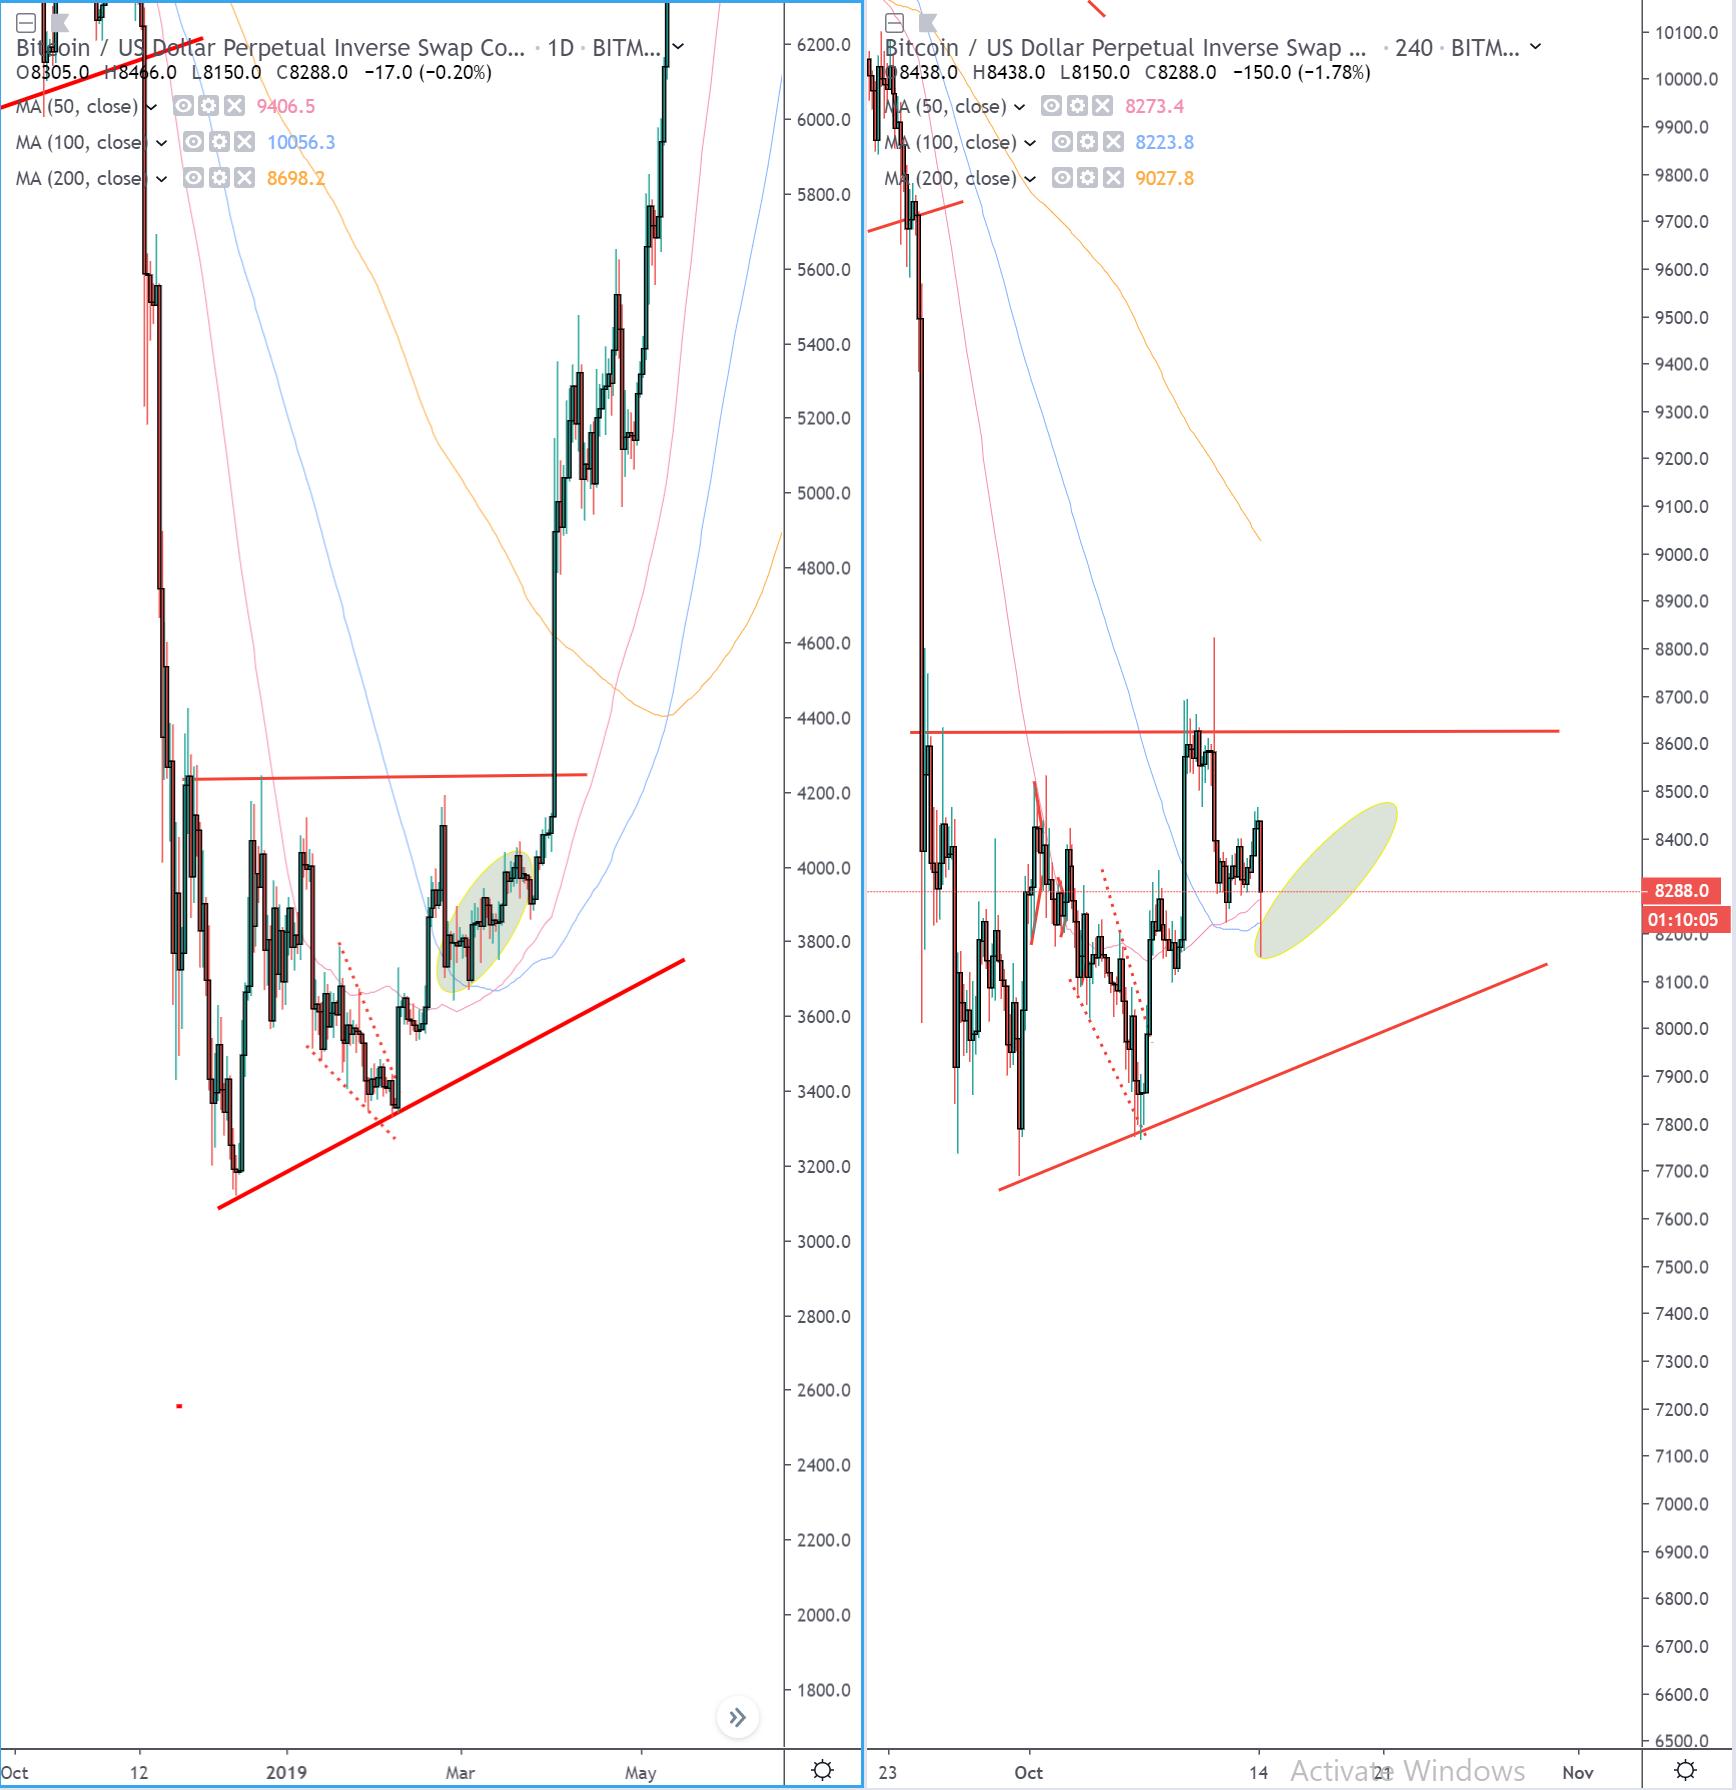
Their fractal thesis, as hinted at earlier, is that Bitcoin’s 20% drop seen a few weeks ago is structurally similar to November’s dramatic drop from $6,000 to $3,000.
Related Reading: Could Bitcoin Collapse By 25% to $6,000? GBTC Premium Implies So
While some have laughed off the similarities of the movements as pure coincidence and mental gymnastics, the fractal has continued to gain traction.
Smartcontracter, a popular Twitter analyst, recently posted the chart below. As can be seen, the price action seen over the past few weeks and back during the capitulation phase of the last bear market are effectively identical. What’s more, the moving averages and trend lines on the charts are in similar formations and territories.

As Smartcontracter explained: “I really feel we have lived and breathed this before. When you compare the 2 scenarios to scale, even all the moving averages are in the same places.”
That’s far from the end of it. Back in December 2018, analysts were mentioning harrowing price targets, eyeing $2,000 (or even low). Now, analysts are calling for moves down to $5,000 or even lower — again, a sign that a fractal is playing out in the current.
Should this fractal play out in full, Bitcoin will rocket back towards $10,000 by the end of this month.
Others have further corroborated this analysis. Truenomic recently drew even more apparent parallels between the current Bitcoin price action and what took place at the end of the bear market. Referencing the charts below, he wrote:
“In addition to the fact that bitcoin moves in cycles, many movements on the chart are repeated on completely different time frames, because these are ordinary patterns. I have gained confidence in the similarity of these two situations, so at the moment I’m bullish.”
$BTC: In addition to the fact that bitcoin moves in cycles, many movements on the chart are repeated on completely different time frames, because these are ordinary patterns. I have gained confidence in the similarity of these two situations, so at the moment I’m bullish. pic.twitter.com/zRp71XcazJ
— Nik Jaremczuk (@truenomic) October 12, 2019
Featured Image from Shutterstock
The post Bitcoin Price Continues to Track Bullish $3,200 Bottom Fractal appeared first on NewsBTC.
Source: https://www.newsbtc.com/2019/10/14/bitcoin-price-continues-to-track-bullish-3200-bottom-fractal/
