- Bitcoin price climbed to $8,950, but failed to continue higher against the US Dollar.
- The price is down around $500, but it is holding the key $8,400 and $8,350 supports.
- There is a major bullish trend line forming with support near $8,400 on the hourly chart of the BTC/USD pair (data feed from Kraken).
- The price could test the $8,350 support and it is likely to recover in the near term.
Bitcoin price is trading with swing moves below $9,000 against the US Dollar. BTC declined sharply from $8,950, but it is now approaching a couple of important supports.
Bitcoin Price Analysis
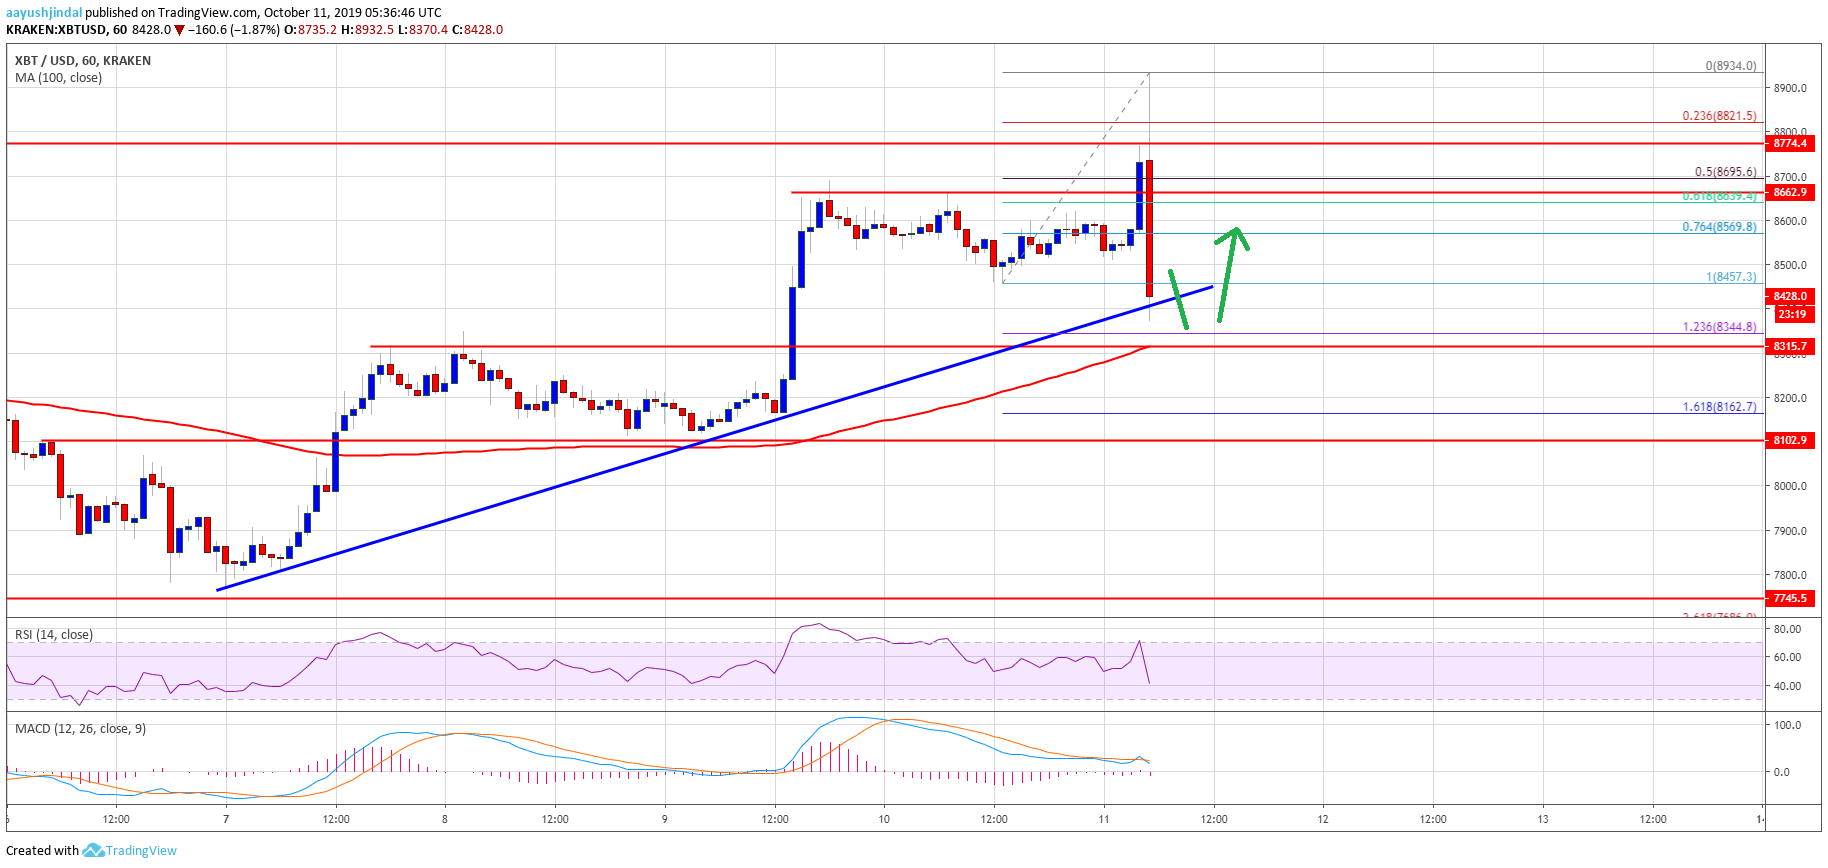
Recently, there was a sharp rise in bitcoin above the $8,600 and $8,650 resistance levels against the US Dollar. Moreover, the price spiked above the $8,800 resistance area and remained well above the 100 hourly simple moving average. The price traded close to the $8,950 level and formed a new weekly high at $8,934. However, the price struggled to continue higher and there was a sharp decline below $8,800.
Additionally, the price broke the 61.8% Fib retracement level of the recent rally from the $8,457 low to $8,934 high. There is a large red candle forming on the hourly chart with body below $8,600. The price even traded below the last swing low at $8,457. However, the $8,400 support area is acting as a decent support. More importantly, there is a major bullish trend line forming with support near $8,400 on the hourly chart of the BTC/USD pair.
The next key support is near the $8,350 level (the previous resistance area). It represents the 1.236 Fib extension level of the recent rally from the $8,457 low to $8,934 high. The main support is near the $8,315 level since it coincides with the 100 hourly SMA. Therefore, a close below the $8,000 support might push the price back into a bearish zone.
On the upside, an initial resistance is near the $8,550 level, followed by $8,600. The main resistances are near the $8,660 and $8,800 levels. It seems like the price might trade in a range above the $8,300 support area before it could start a fresh increase.
Looking at the chart, bitcoin is showing a lot of bearish signs from the $8,934 swing high. It seems like it was rejected close to $9,000. It is currently approaching the $8,350 and $8,300 support levels, where the bulls are likely to take a stand.
Technical indicators:
Hourly MACD – The MACD is currently gaining strength in the bearish zone.
Hourly RSI (Relative Strength Index) – The RSI for BTC/USD is down sharply and is below the 50 level.
Major Support Levels – $8,350 followed by $8,300.
Major Resistance Levels – $8,550, $8,660 and $8,800.
The post Bitcoin (BTC) Price Dives $500 But Holding Key Support appeared first on NewsBTC.
Source: https://www.newsbtc.com/2019/10/11/bitcoin-btc-price-dives-500-but-holding-key-support/

