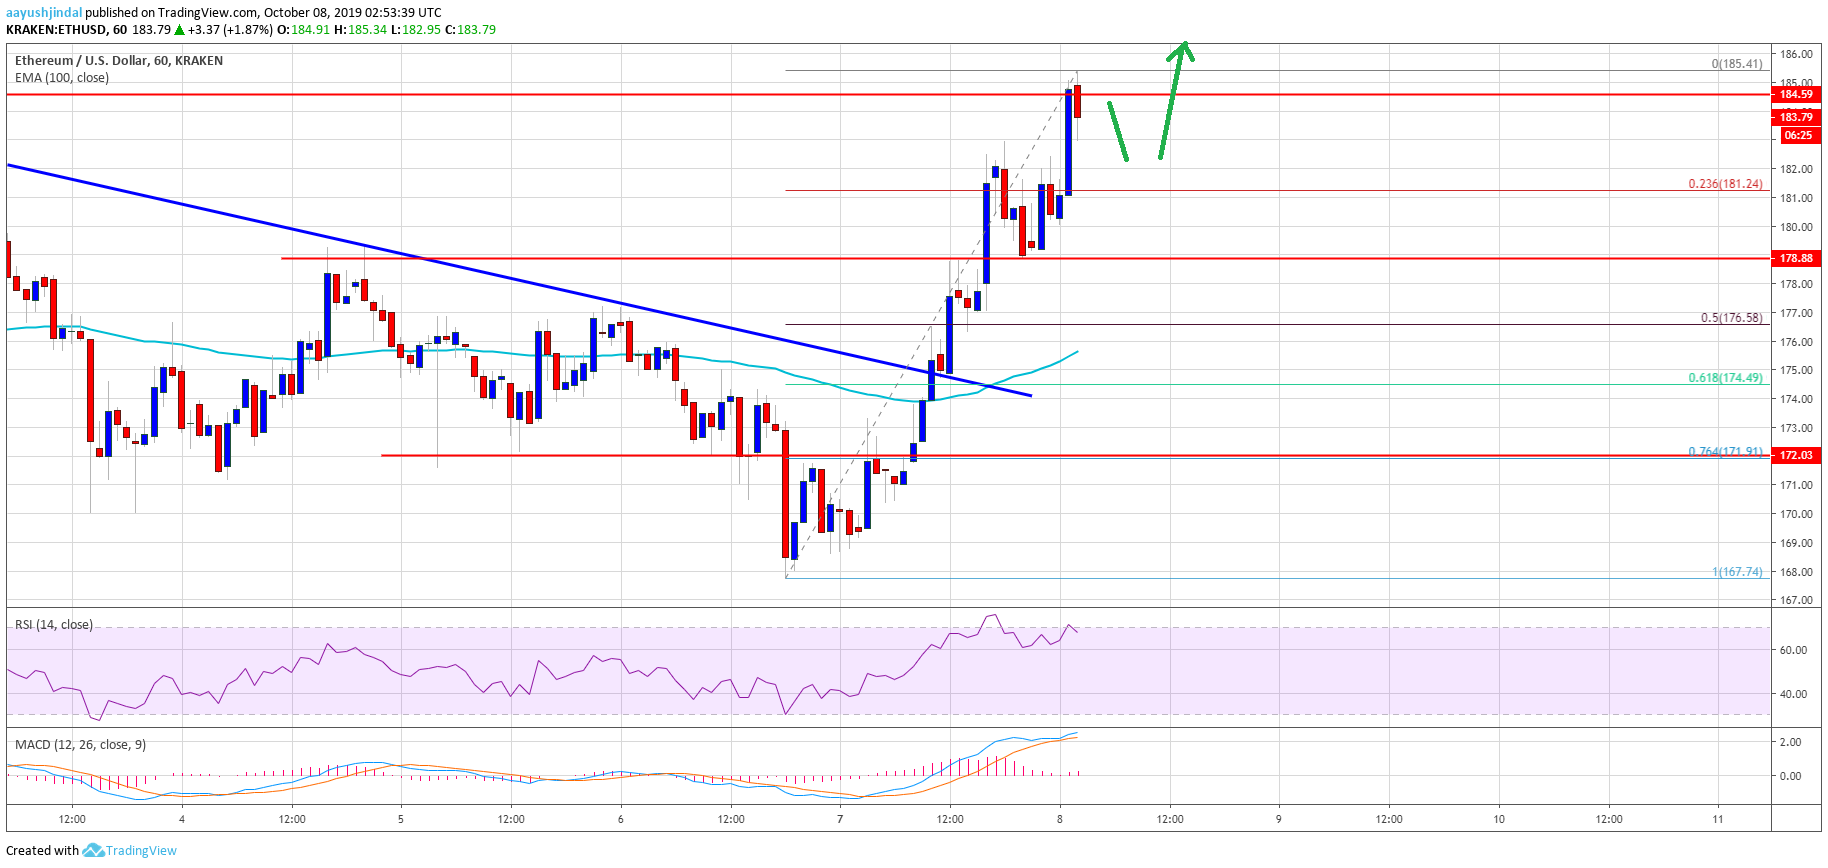
- ETH price is climbing higher and it recently broke the $175 and $180 resistances against the US Dollar.
- The price is currently trading near a crucial resistance area at $185 and $186.
- There was a break above a key bearish trend line with resistance near $175 on the hourly chart of ETH/USD (data feed via Kraken).
- The pair might correct a few points lower, but it is likely to climb higher towards $190 or $192.
Ethereum price is up close to 10% versus the US Dollar, and climbed nicely vs bitcoin. ETH price could soon attempt to surpass $185 and climb towards $192.
Ethereum Price Analysis
After forming a support base near $170, Ethereum started a decent rebound against the US Dollar. As a result, ETH price traded above the $175 and $180 resistance levels. Moreover, there was a close above the $180 level and the 100 hourly simple moving average. The price is currently up around 10% and it even tested the main $185 resistance, where the bears took a stand.
During the rise, there was a break above a key bearish trend line with resistance near $175 on the hourly chart of ETH/USD. The price is currently consolidating gains below the $185 resistance. An immediate support is near the $182 level. Moreover, the 23.6% Fib retracement level of the recent rise from the $167 low to $185 high is also near the $181 level.
If there is an extended decline or correction, the price could test the $178 and $175 support levels. The 50% Fib retracement level of the recent rise from the $167 low to $185 high is positioned near the $176 level to provide support in the near term. Any further losses might push the price back in a bearish zone towards the $170 support area.
On the upside, the main resistances are near the $185 and $186 level. The current price action suggests high chances of an upside break above the $185 resistance. In the mentioned case, the price could test the $190 and $192 resistance levels. The next key resistance area is near the $198 and $200 levels.
Looking at the chart, Ethereum price is trading with a nice bullish bias above the $180 level. Having said that, the bulls need to gain strength above the $185 and $186 resistance levels to push the price into an uptrend. If not, there are chances of a fresh decline towards the $175 level.
ETH Technical Indicators
Hourly MACD – The MACD for ETH/USD is slowly losing pace in the bullish zone.
Hourly RSI – The RSI for ETH/USD is currently correcting lower towards the 60 level.
Major Support Level – $180
Major Resistance Level – $185
The post Ethereum (ETH) Price Rallies 10% But Can It Break $185? appeared first on NewsBTC.
Source: https://www.newsbtc.com/2019/10/08/ethereum-eth-price-rallies-10-but-can-it-break-185/

