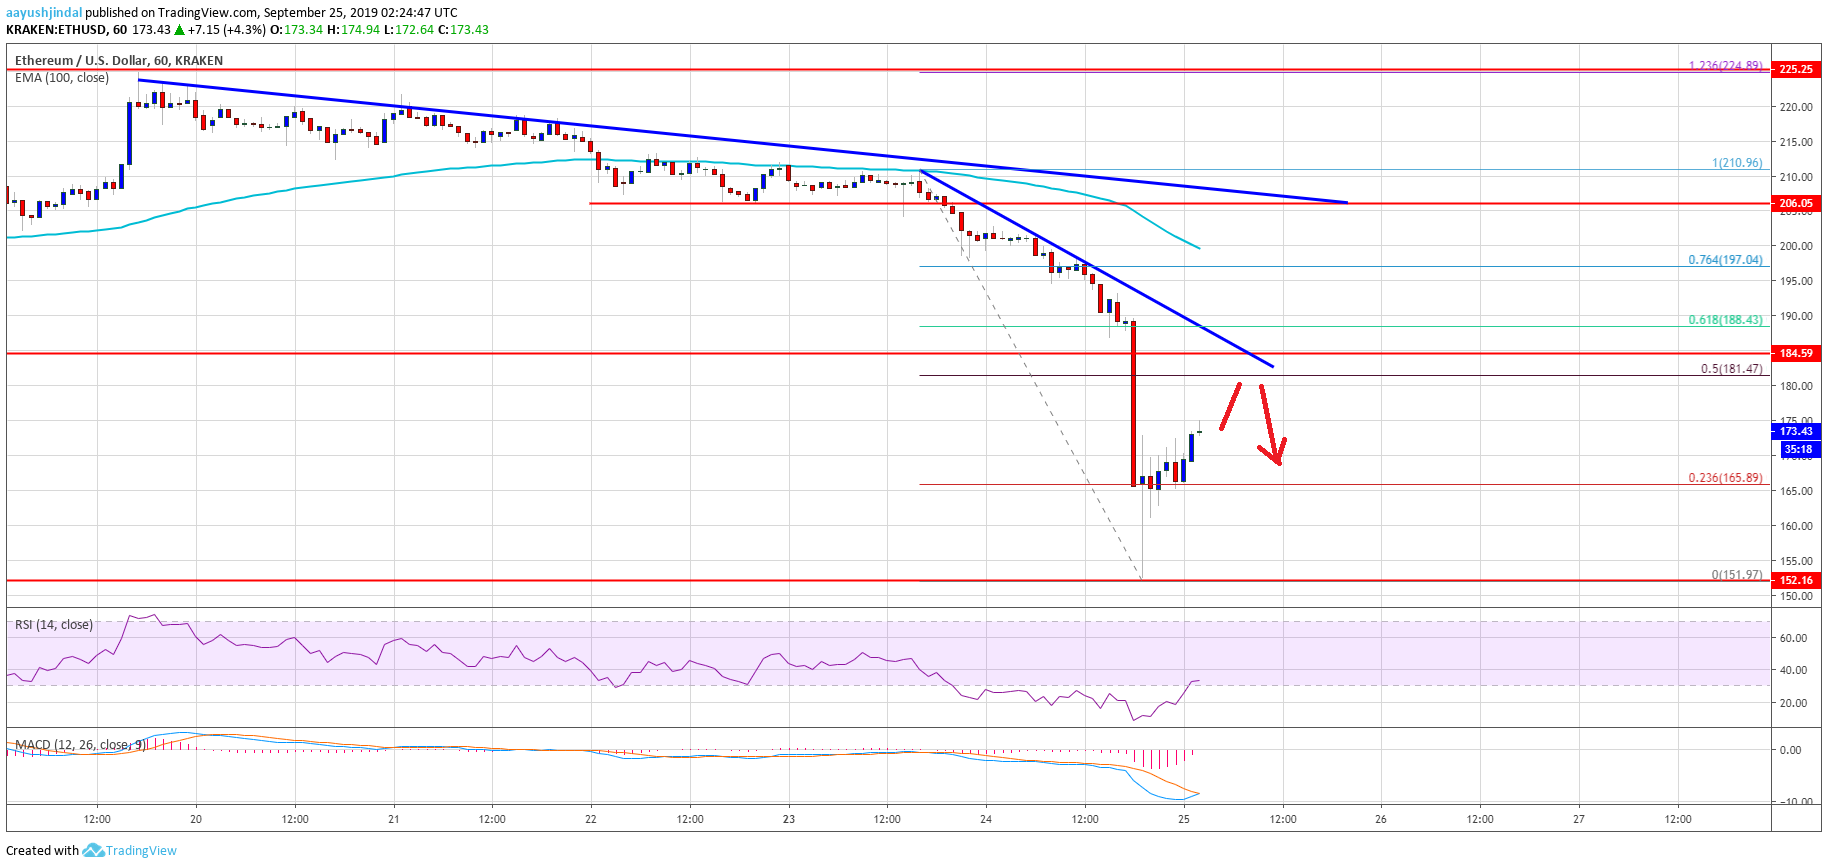
- ETH price declined heavily and tumbled more than 10% below $185 against the US Dollar.
- The price is currently correcting higher after it traded close to the $150 level.
- There is a new major bearish trend line forming with resistance near $182 on the hourly chart of ETH/USD (data feed via Kraken).
- Bitcoin price is down more than 10% and it broke the $9,000 support area.
Ethereum price is back in a downtrend below $185 versus the US Dollar, similar to bitcoin below $10,000. ETH price might correct higher, but it is likely to struggle near $185.
Ethereum Price Analysis
In the past few hours, there was a sharp decline in Ethereum, bitcoin, ripple, and major other cryptocurrencies against the US Dollar. ETH price tumbled below the $200 and $185 support levels. Moreover, there was a close below the $185 level and the 100 hourly simple moving average. The decline was such that the price crashed close to $150 on the Kraken exchange. A new monthly low was formed near $152 and the price is currently correcting higher.
There was a break above the $165 level, plus the 23.6% Fib retracement level of the recent drop from the $210 high to $152 swing low. The price is now trading above the $170 level, but there are many hurdles on the upside near the $180 and $182 levels. Moreover, there is a new major bearish trend line forming with resistance near $182 on the hourly chart of ETH/USD.
The trend line coincides with the 50% Fib retracement level of the recent drop from the $210 high to $152 swing low. More importantly, the previous support near the $185 level might once again act as a resistance. Above $185, Ethereum price could recover towards the $200 resistance area and the 100 hourly SMA. Conversely, the price could complete the current correction near the $180 or $185 resistance.
An initial support on the downside is near the $165 level. If there is a fresh decrease below $165, the price may perhaps retest the $152 low. Any further losses could push the price below the $150 support area in the coming sessions.
Looking at the chart, Ethereum price is clearly back in a downtrend with a close below $200 and $185. As long as the price is below the $185 and $200 resistances, it remains at a risk of another drop towards the $150 support in the near term.
ETH Technical Indicators
Hourly MACD – The MACD for ETH/USD is about to move back into the bullish zone.
Hourly RSI – The RSI for ETH/USD is currently correcting higher from the 10 level.
Major Support Level – $165
Major Resistance Level – $185
The post Ethereum (ETH) Price Flash Crash To $150, Bitcoin Dives 10% appeared first on NewsBTC.
Source: https://www.newsbtc.com/2019/09/25/ethereum-eth-price-flash-crash-to-150-bitcoin-dives-10/

