- ETH price is finding a strong buying interest near the $165 level against the US Dollar.
- The price is currently climbing higher and testing a major resistance area near $180 and $182.
- There was a break above a major bearish trend line with resistance near $176 on the 4-hours chart of ETH/USD (data feed via Kraken).
- There are a few bullish signs emerging, suggesting an upside break above the $182 resistance.
Ethereum price is showing positive signs against the US Dollar, while bitcoin is rising. ETH might surge once it clears the main $180 and $182 resistance levels.
Ethereum Price Weekly Analysis
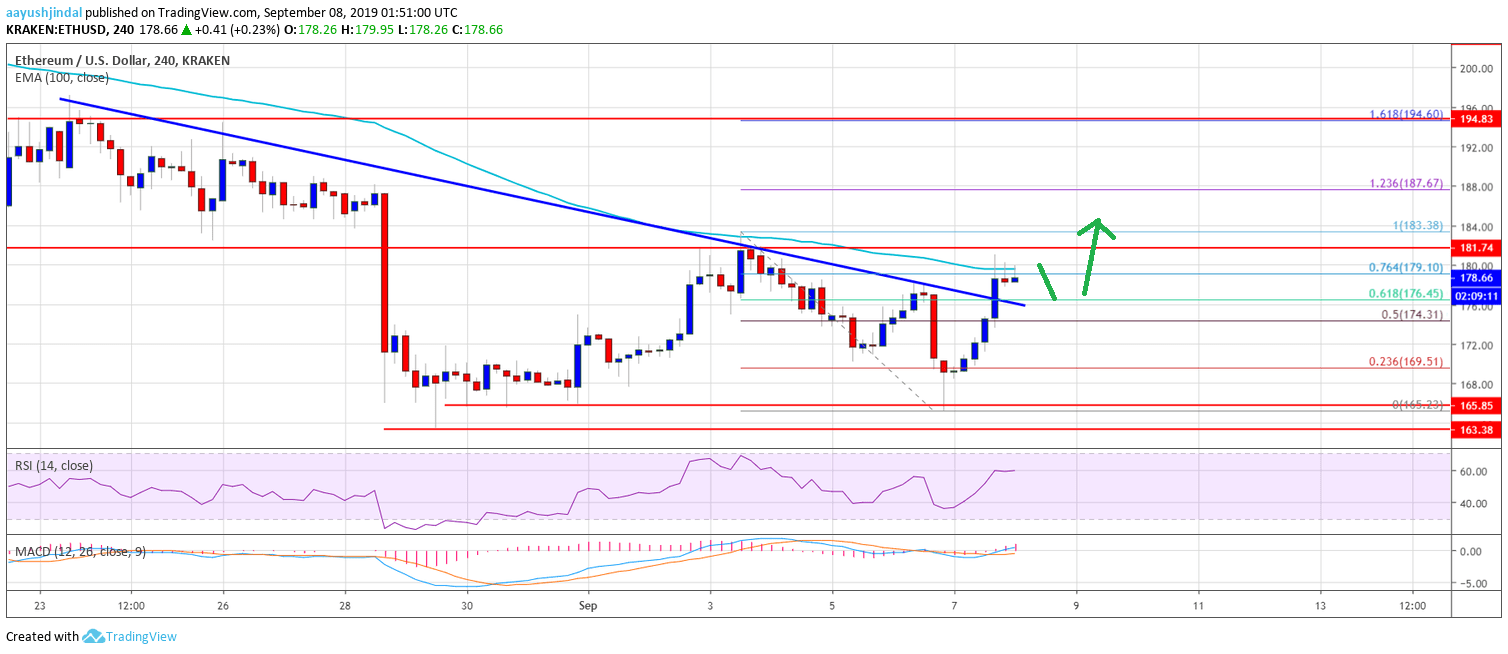
This past week, there was a major rejection noted near the $180 resistance in ETH against the US Dollar. However, bitcoin price remained well bid and gained traction above the $10,500 resistance. However, Ether declined below the $170 level and 100 simple moving average (4-hours). Moreover, the price retested the main $165 support area, where the bulls took a stand.
A swing low was formed near $165 and the price recently climbed higher. It broke the $175 resistance plus the 50% Fib retracement level of the last decline from the $183 high to $165 swing low. Moreover, there was a break above a major bearish trend line with resistance near $176 on the 4-hours chart of ETH/USD. The pair is now trading with a positive bias above the $175 level.
It is currently trading near the 76.4% Fib retracement level of the last decline from the $183 high to $165 swing low. Additionally, it is testing the $180 resistance and the 100 simple moving average (4-hours). If there is an upside break above the $180 and $182 resistance levels, there could be more gains. The next resistance is near the $188 level plus the 1.236 Fib extension level of the last decline from the $183 high to $165 swing low.
On the other hand, there could be another downside reaction if there is no upside break above the $182 resistance. An immediate support is near the $175 level, below which the price could test $170.
The above chart indicates that Ethereum price is clearly showing a few positive signs above the $175 level. If he bulls gain traction above $180 and $182, there could be a bullish reversal towards $190 and $195. On the downside, the main support is near the $165 level, below which the price could turn bearish in the near term.
Technical Indicators
4 hours MACD – The MACD for ETH/USD is slowly gaining momentum in the bullish zone.
4 hours RSI – The RSI for ETH/USD is currently well above the 50 level, with a flat bias.
Major Support Level – $165
Major Resistance Level – $182
The post Ethereum Price Weekly Forecast: ETH Signaling Bullish Reversal appeared first on NewsBTC.
Source: https://www.newsbtc.com/2019/09/08/ethereum-price-weekly-forecast-eth-signaling-bullish-reversal/

