- Bitcoin price is trading above a couple of important supports near $11,800 against the US Dollar.
- The price could rally sharply if there is a successful close above the $12,000 resistance.
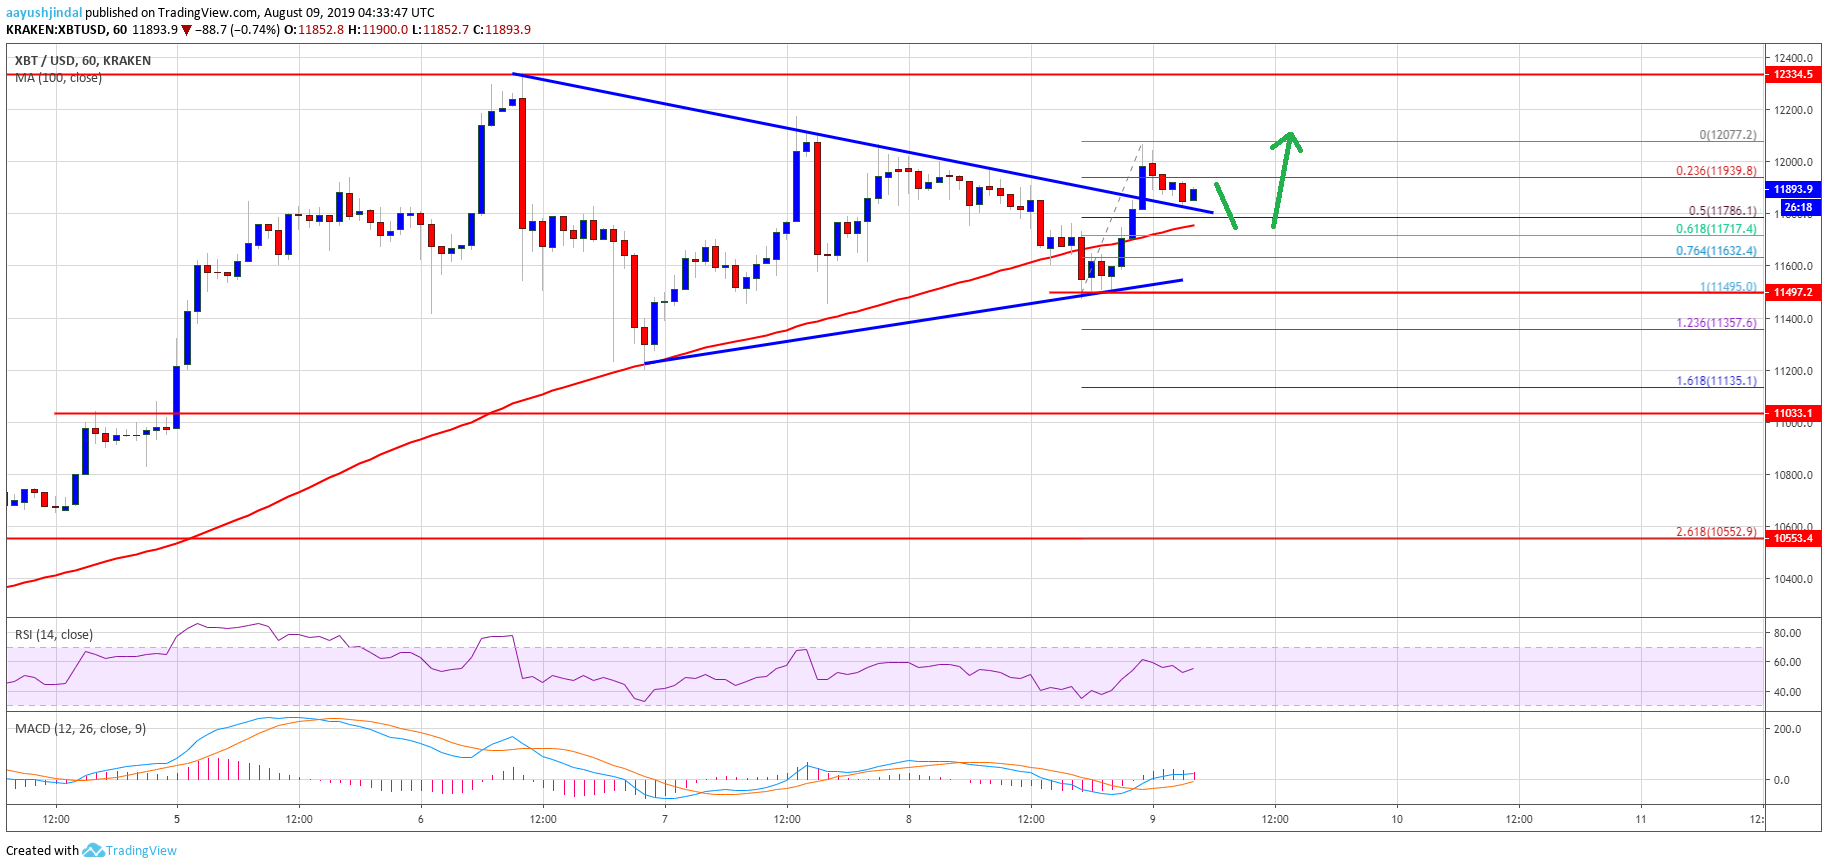
- There was a break above a major contracting triangle with resistance near $11,860 on the hourly chart of the BTC/USD pair (data feed from Kraken).
- The price is showing positive signs, suggesting high chances of an upside break above the $12,000 level.
Bitcoin price is struggling to clear the key $12,000 resistance against the US Dollar. However, BTC price could climb higher as long as it is above the $11,500 support.
Bitcoin Price Analysis
Recently, there was a minor downside correction in bitcoin price from the $12,000 resistance against the US Dollar. The BTC/USD pair traded below the $11,800 support. Moreover, there was a break below $11,650 and the 100 hourly simple moving average. However, the price found a strong buying interest near the $11,500 support area. A swing low was formed near $11,495 and the price recently climbed higher.
There was a break above the $11,800 resistance and the 100 hourly SMA. Moreover, there was a break above a major contracting triangle with resistance near $11,860 on the hourly chart of the BTC/USD pair. The pair even cleared the $12,000 resistance, but it failed to continue higher. A swing high was formed near $12,077 and the price is currently correcting gains.
It traded below $12,000 plus the 23.6% Fib retracement level of the recent wave from the $11,495 low to $12,077 high. However, there is a strong support forming near the $11,750 level and the 100 hourly SMA. The 50% Fib retracement level of the recent wave from the $11,495 low to $12,077 high is also a decent support near the $11,786 level.
Besides, the broken triangle zone could act as a support near $11,750. The main support on the downside is near the $11,500 level, below which the price could turn bearish in the near term. On the upside, there is a cluster of resistances near the $12,000 and $12,100 levels. Therefore, a successful close above $12,000 is needed for a sustained upward move.
Looking at the chart, bitcoin price is holding a couple of important supports near $11,750 and $11,700. Having said that, the price will only turn bearish in the short term if there is a daily close below $11,500. On the upside, the bulls could target $12,300 and $12,500.
Technical indicators:
Hourly MACD – The MACD is currently showing negative signs in the bullish zone.
Hourly RSI (Relative Strength Index) – The RSI for BTC/USD is currently placed nicely above the 50 level.
Major Support Levels – $11,750 followed by $11,500.
Major Resistance Levels – $12,000, $12,100 and $12,200.
The post Bitcoin (BTC) Price Is Trading In Uptrend But Can Bulls Clear $12K? appeared first on NewsBTC.
Source: https://www.newsbtc.com/2019/08/09/bitcoin-price-btc-in-uptrend-can-bulls-clear-12k/

