- ETH price found support near the $210 level and recently climbed higher against the US Dollar.
- The price broke the $215 resistance and it seems like there could be more gains in the near term.
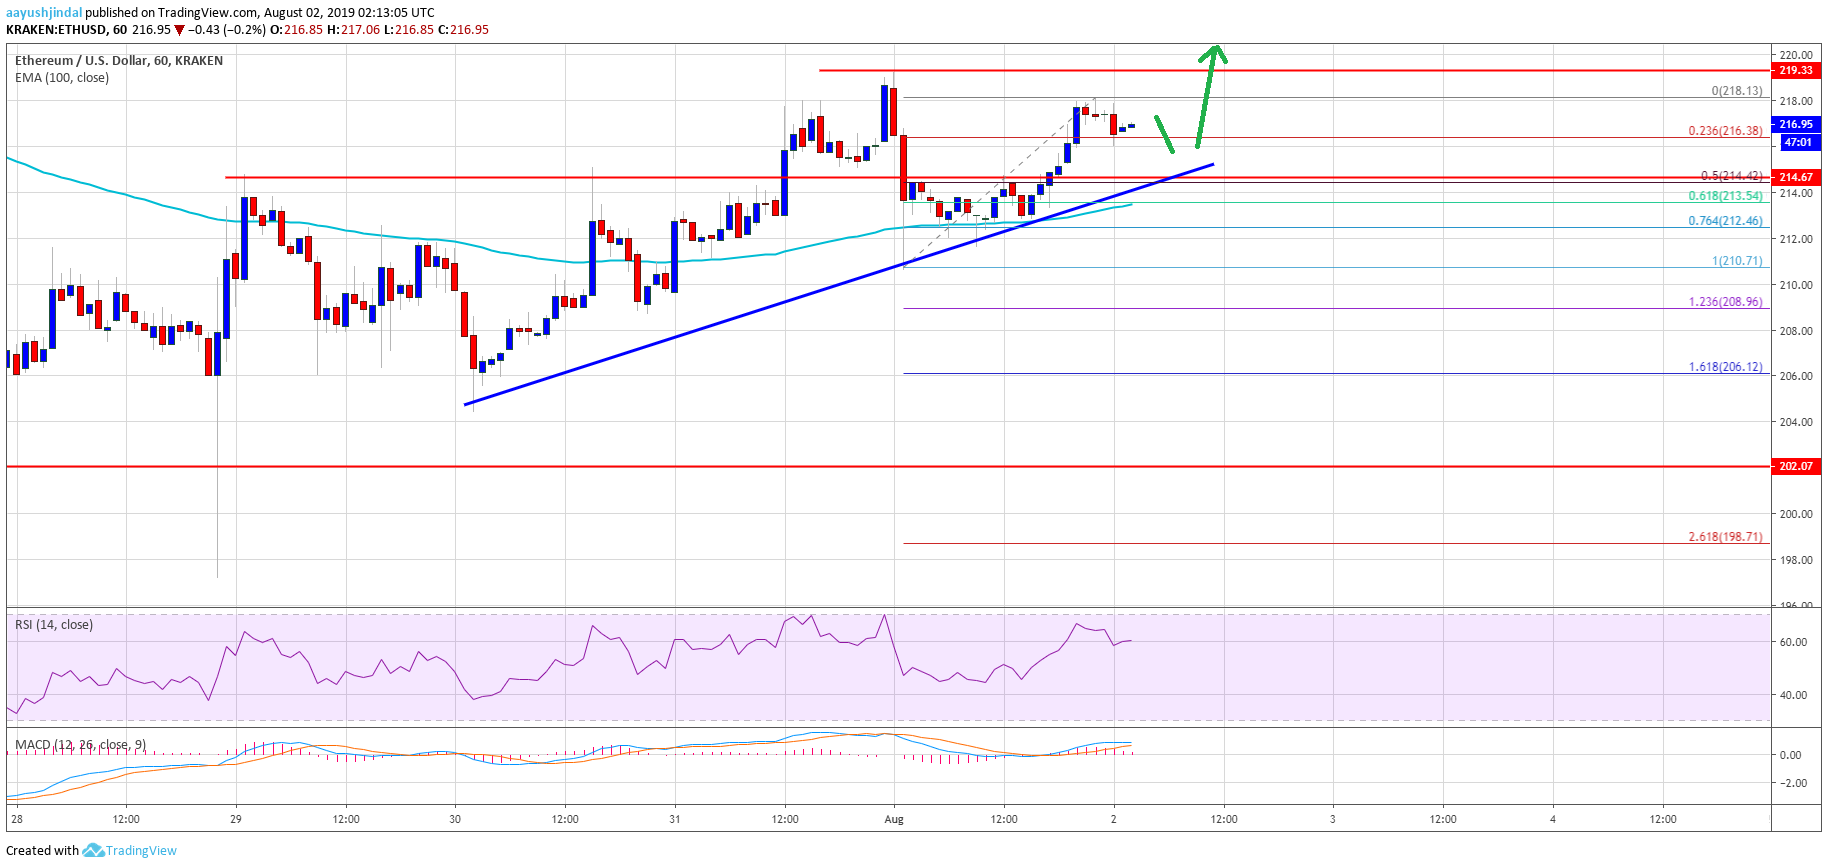
- There is a connecting bullish trend line forming with support near $214 on the hourly chart of ETH/USD (data feed via Kraken).
- The pair is currently trading with a bullish angle and it could even surpass the $220 resistance.
Ethereum price is trading with a positive bias versus the US Dollar, and bitcoin rallied above $10,200. ETH price may also gain traction and climb above the $220 resistance.
Ethereum Price Analysis
Yesterday, we discussed the importance of the $210 support for Ethereum price against the US Dollar. The ETH/USD pair corrected lower, but it stayed above the $210 support level. More importantly, there was no close below the 100 hourly simple moving average, and the price climbed back above the $215 level. Additionally, bitcoin price performed really well and climbed above the key $10,200 resistance.
Recently, ETH price climbed above the $216 level and formed a swing high at $218. It is currently struggling to continue higher above $218 and $220. An immediate support is near the $216 level plus the 23.6% Fib retracement level of the upward wave from the $210 low to $218 high. Moreover, there is a connecting bullish trend line forming with support near $214 on the hourly chart of ETH/USD.
The trend line support is near the 50% Fib retracement level of the upward wave from the $210 low to $218 high. Therefore, dips towards the $214 level might find a strong buying interest. The next major support is near the $212 level and the 100 hourly simple moving average. If there is a successful close below the 100 hourly SMA, the price could even break the $210 support level.
On the upside, the $218 level is an initial resistance. The main resistance is near the $220 level. If there is an upside break above the $220 resistance, the price could climb higher positively towards the $225 and $230 levels.
Looking at the chart, Ethereum price is trading with a positive bias above the $212 and $214 levels. Therefore, there are chances of more upsides above the $218 and $220 levels in the near term. Only a close below the 100 hourly SMA and $210 might negate the current bullish view.
ETH Technical Indicators
Hourly MACD – The MACD for ETH/USD is losing momentum in the bullish zone.
Hourly RSI – The RSI for ETH/USD is currently moving higher and is well above the 50 level.
Major Support Level – $210
Major Resistance Level – $220
The post Ethereum Price (ETH) Primed For More Gains As Bitcoin Breaks Key Hurdle appeared first on NewsBTC.

