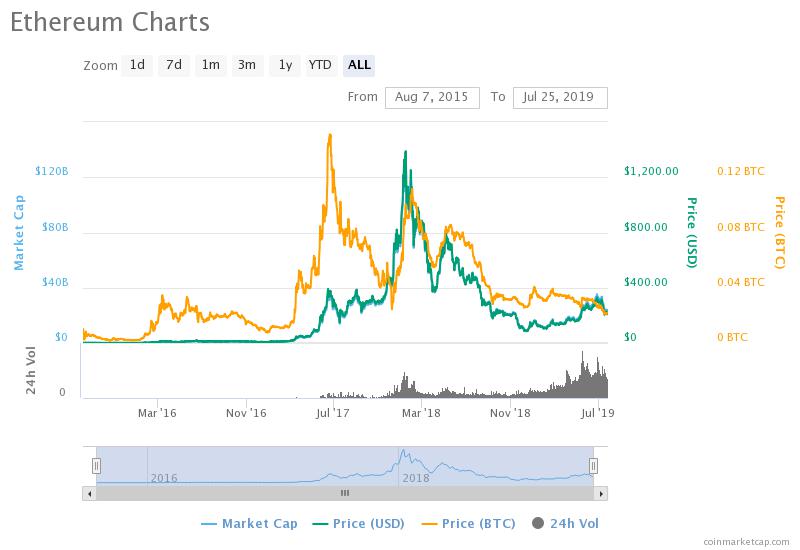
During Bitcoin’s meteoric rise to stardom and mainstream media back in 2017, another crypto asset also skyrocketed during this time. Due to the ICO boom, thousands of new ERC-20 altcoins were created on the Ethereum blockchain to take advantage of both the influx of capital from retail investors hoping to get rich and the coming industry hype and growth.
But now that the ICO boom has ended, demand for Ethereum to use to fund ICOs has dropped, causing the cryptocurrency to drop as much as 94% from its previous all-time high, and is still down 85% from the number even though Bitcoin reclaimed most of its all-time high. But the discrepancy in reclaiming lost gains may end soon enough, as crypto analysts have discovered a potential pattern in Ethereum price charts that could cause Ethereum to increase 1000% relative to Bitcoin.
Ethereum Price Ready for 1000% Gains on BTC Ratio?
Back in 2017, early crypto investors experienced an “alt season” that sent the prices of crypto altcoins like Ethereum, Ripple, and Litecoin skyrocketing in relation to their Bitcoin ratios, and as a result, their USD value. Lighting struck twice again as Bitcoin set a new all-time high, and these alternative crypto assets set one as well, both in USD and BTC values.
Related Reading | BTC Dominance Drops as Bitcoin Breaks Uptrend: Is Alt Season Finally Here?
But since the first week of 2018, altcoins have only fallen steadily in their ratio against Bitcoin, and have recently begun to capitulate as investors cashed out underperforming altcoins for the previously parabolic Bitcoin.

Bitcoin has grown so much in price, yet assets like Ethereum are still down 85% from their all-time high. If the current ratios are maintained, even if Bitcoin went all the way to $100,000 altcoins would never again see a new all-time high.
But crypto analysts think otherwise and have spotted a potential pattern in Ethereum price charts that if it plays out, would cause Ethereum to rise 1000% on its BTC ratio.
#Ethereum pic.twitter.com/C75oB9PvYG
— paTo..
(@crypToBanger) July 25, 2019
In a similar-looking chart shared by two separate crypto analysts, past Ethereum high and low cycles can be seen, and the pattern might hint at what Ethereum price will do in the coming months ahead.
Left without a comment. pic.twitter.com/Gp7J1pvXCu
— Panama ₿ (@Panama_TJ) July 24, 2019
Should these patterns play out, the promise of alt season may finally become a reality, and Ethereum could possibly lead the charge as one of the major altcoins with the most ground to regain. However, if ratios were to stay the same, and Bitcoin were to crash significantly, Ethereum may still be a far ways off from setting a new USD all-time high, even if it sets one again in BTC ratio.
The post Ethereum Price Chart Shows Possible Pattern to 1000% Gains Against Bitcoin appeared first on NewsBTC.
Source: https://www.newsbtc.com/2019/07/25/ethereum-price-chart-bitcoin/
