- Ripple price failed to climb above the $0.3230 resistance and resumed decline against the US dollar.
- The price broke the $0.3000 support level and traded to a new monthly low at $0.2835.
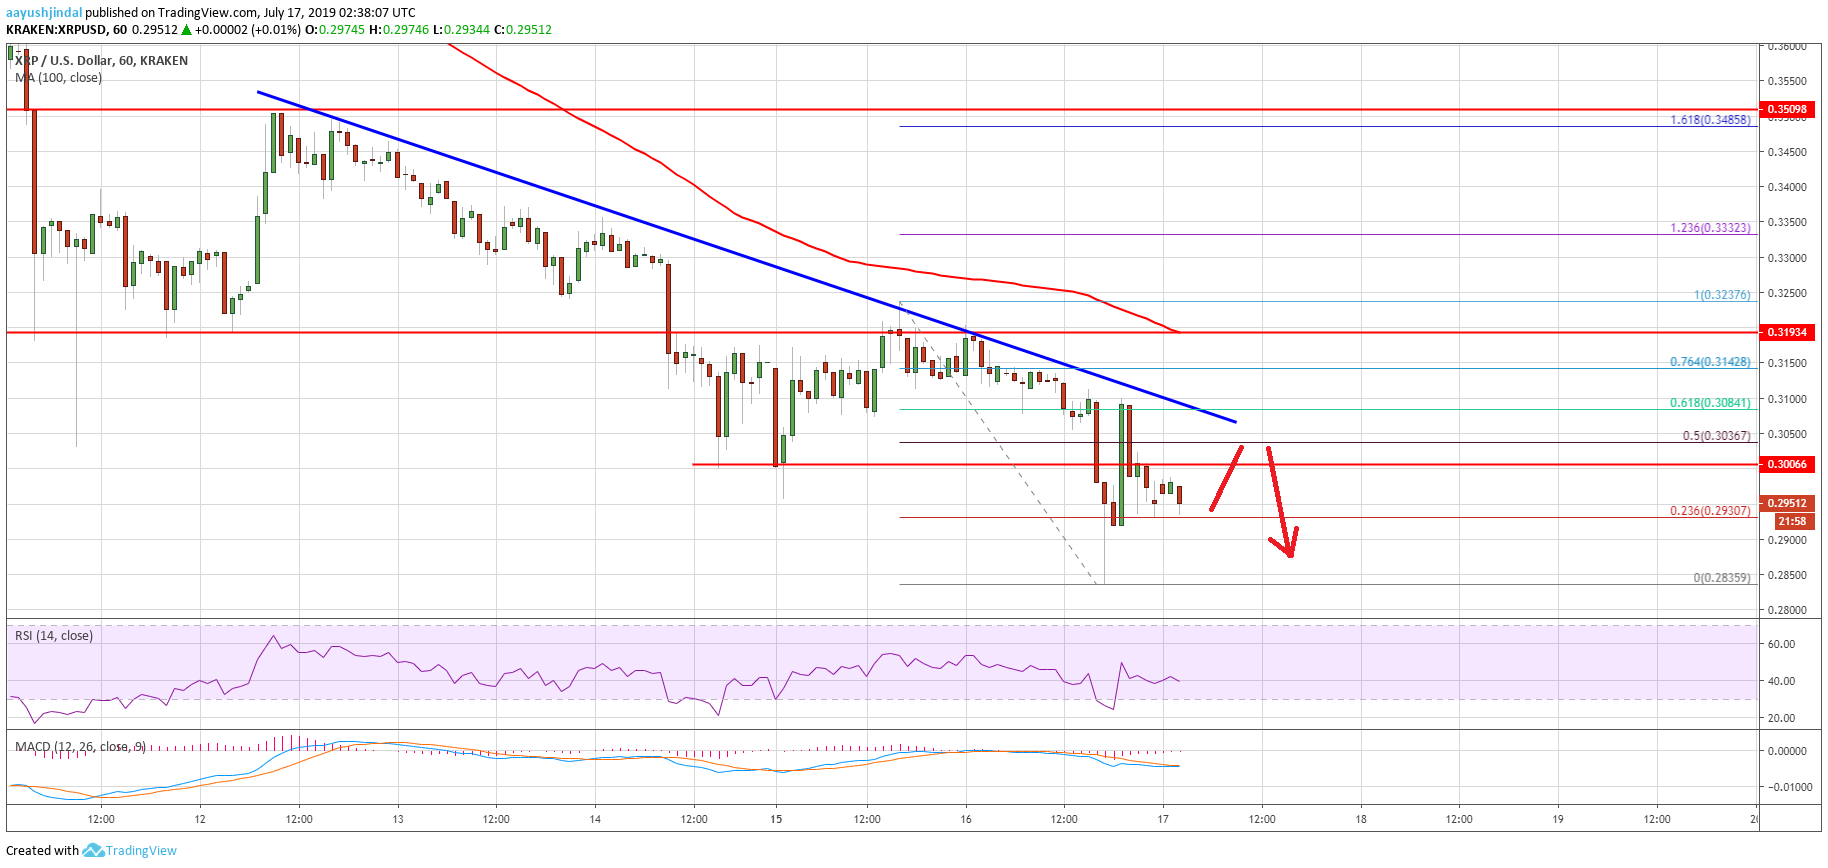
- This week’s followed bearish trend line is active with resistance at $0.3075 on the hourly chart of the XRP/USD pair (data source from Kraken).
- The price could decline below $0.2800 if it continues to struggle near $0.3075 and $0.3100.
Ripple price is holding an important support against the US Dollar, while bitcoin and Ethereum dived nearly 15%. XRP price could extend its decline if there is a break below the $0.2800 support.
Ripple Price Analysis
Yesterday, we saw a decent upside correction in ripple price above $0.3100 against the US Dollar. However, the XRP/USD pair struggled to gain momentum above the $0.3200 and $0.3230 resistance levels. The price topped near the $0.3230 level and remained well below the 100 hourly simple moving average. As a result, there was a fresh bearish reaction and the price declined below the $0.3150 and $0.3100 support levels.
More importantly, the recent significant decline bitcoin and Ethereum pushed ripple price below the $0.3000 support level. However, losses were limited and the price traded to a new monthly low at $0.2835. It even corrected higher above the $0.3000 level plus the 50% Fib retracement level of the recent decline from the $0.3237 high to $0.2835 low. The upward move was capped by the $0.3080 level.
The price failed to break the 61.8% Fib retracement level of the recent decline from the $0.3237 high to $0.2835 low. Moreover, this week’s followed bearish trend line is active with resistance at $0.3075 on the hourly chart of the XRP/USD pair. Therefore, the price might struggle to break the $0.3075 and $0.3100 resistance levels. If there is an upside break above $0.3100, the price could correct towards the $0.3200 level and the 100 hourly SMA.
On the other hand, if the price fails to break the $0.3100 resistance, it could slide again. An immediate support is near the $0.2900 level, below which the price may even break the recent low at $0.2835. The next important support is near the $0.2800 and $0.2780 levels.
Looking at the chart, ripple price is currently struggling to gain bullish momentum above $0.3000. Therefore, there is a risk of more losses below the $0.2900 and $0.2800 levels in the near term.
Technical Indicators
Hourly MACD – The MACD for XRP/USD is struggling to move back into the bullish zone.
Hourly RSI (Relative Strength Index) – The RSI for XRP/USD is currently near the 40 level, with a bearish angle.
Major Support Levels – $0.2850, $0.2800 and $0.2780.
Major Resistance Levels – $0.3075, $0.3100 and $0.3200.
The post Ripple Price (XRP) Holding Ground While Bitcoin Dived 15% appeared first on NewsBTC.
Source: https://www.newsbtc.com/2019/07/17/ripple-price-xrp-holding-ground-while-bitcoin-dived-15/

