- Ripple price rallied significantly above the $0.4500 and $0.5000 resistances against the US dollar.
- The price traded as high as $0.5087 before it started a sharp downside correction.
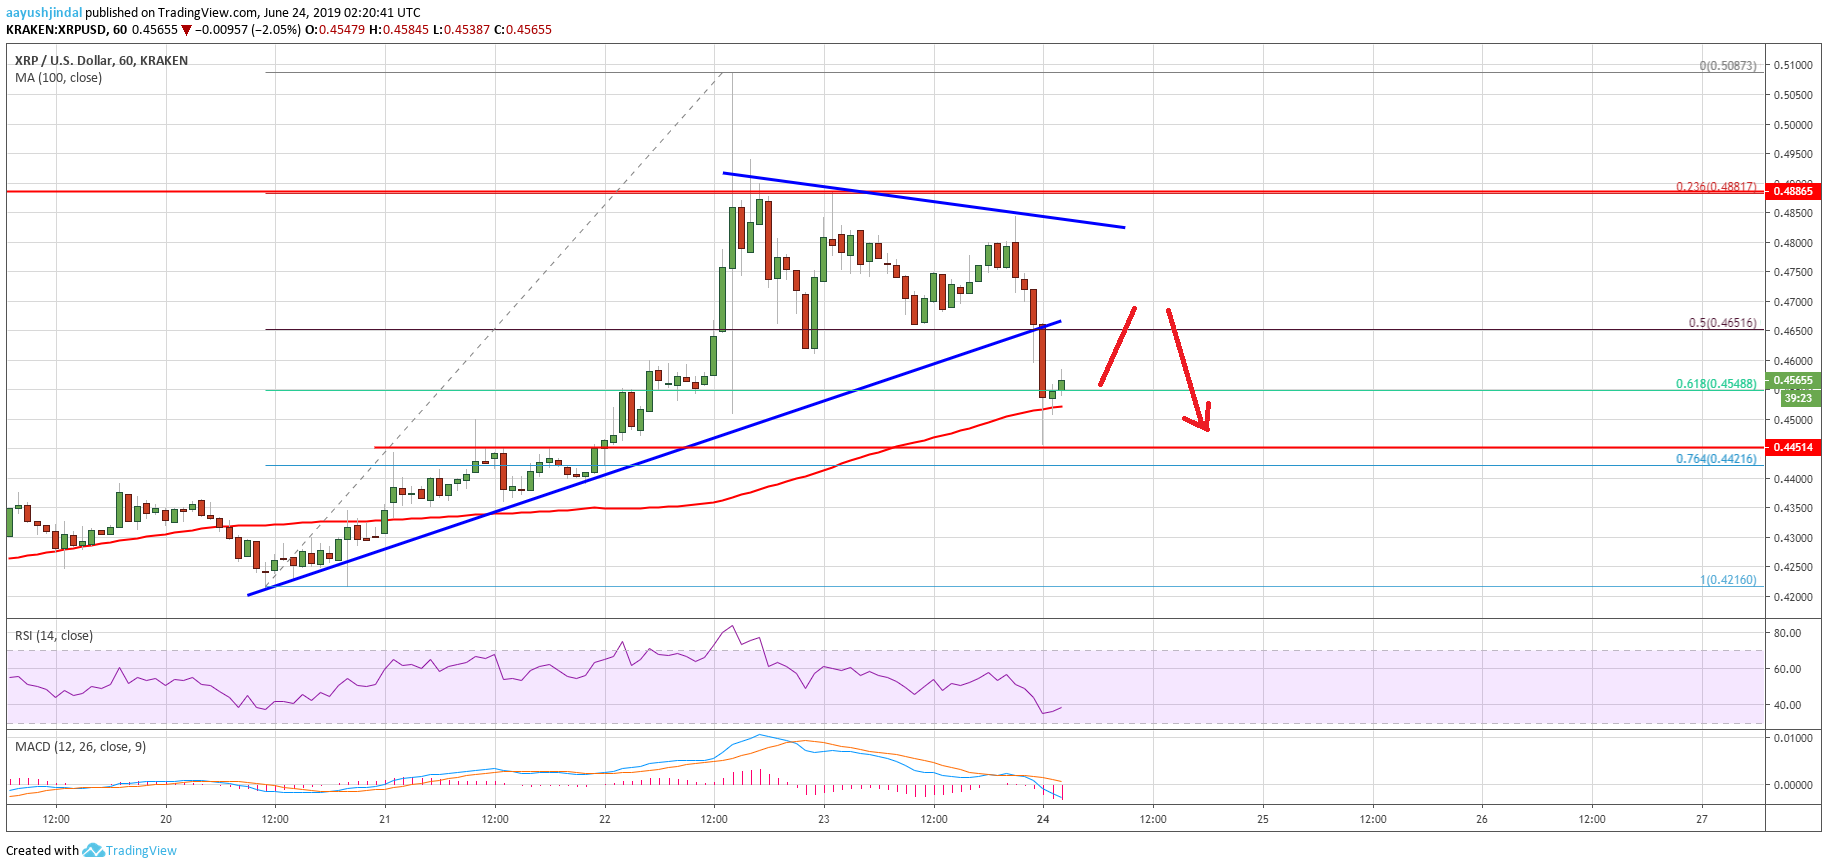
- There was a break below a key bullish trend line with support near $0.4650 on the hourly chart of the XRP/USD pair (data source from Kraken).
- Both Ethereum and bitcoin also corrected lower and are trading in a range.
Ripple price trimmed most its recent gains against the US Dollar and bitcoin. XRP price is now trading near an important support and it could bounce back.
Ripple Price Analysis
Recently, there was a sharp upward move in ripple price above the key $0.4500 resistance against the US Dollar. The XRP/USD pair gained strength and rallied above the $0.4800 and $0.4950 resistance levels. There was also a close above the $0.4500 level and the 100 hourly simple moving average. Finally, the price rallied above the $0.5000 resistance and traded to a new monthly high at $0.5087.
However, ripple failed to stay in a positive zone and recently declined heavily below $0.5000. There was a break below a key bullish trend line with support near $0.4650 on the hourly chart of the XRP/USD pair. Moreover, there was a break below the 50% Fib retracement level of the last wave from the $0.4216 low to $0.5087 high. The pair even broke the $0.4550 level, but the $0.4500 support and the 100 hourly SMA acted as strong supports.
Ripple traded close to the 76.4% Fib retracement level of the last wave from the $0.4216 low to $0.5087 high. It is now trading nicely above $0.4500 and the 100 hourly SMA. On the upside, an initial resistance is near the $0.4620 and $0.4650 levels. If there is a successful break above the $0.4650 level, the price could start a fresh increase in the near term.
If not, there is a risk of another decline towards $0.4500 or even $0.4450. The key support is near the $0.4450 level, below which there is a risk of more losses.
Looking at the chart, ripple price is clearly trading near a crucial support area at $0.4500. As long as there is no close below the 100 hourly SMA, XRP could start a fresh increase above $0.4600 and $0.4650. Above $0.4650, the next major hurdle is near $0.4820 and a connecting bearish trend line on the same chart.
Technical Indicators
Hourly MACD – The MACD for XRP/USD is currently gaining momentum in the bearish zone.
Hourly RSI (Relative Strength Index) – The RSI for XRP/USD is now above the 50 level, with a minor bullish angle.
Major Support Levels – $0.4500, $0.4450 and $0.4420.
Major Resistance Levels – $0.4600, $0.4650 and $0.4820.
The post Ripple Price (XRP/USD) Trimmed Gains But Testing Crucial Support appeared first on NewsBTC.
Source: https://www.newsbtc.com/2019/06/24/ripple-price-xrp-usd-testing-crucial-support/

