- Bitcoin price traded to yet another 2019 high near $9,470 and corrected lower against the US Dollar.
- The price is trading nicely above the $9,200, $9,150 and $9,000 support levels.
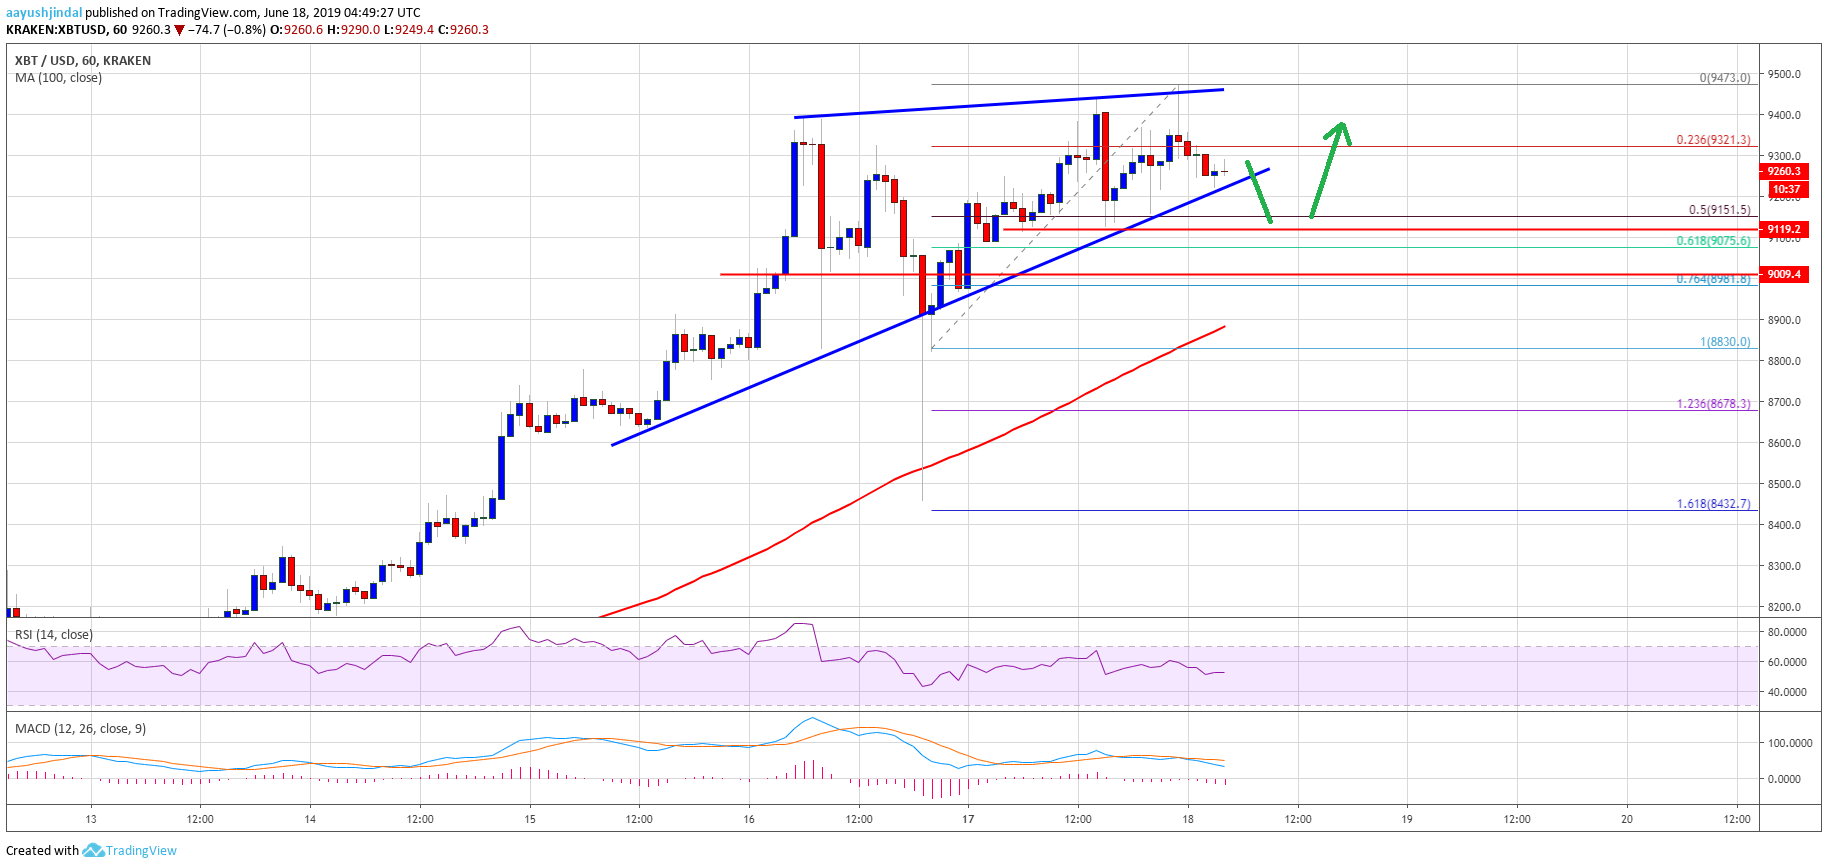
- There is a key breakout pattern forming with support near $9,220 on the hourly chart of the BTC/USD pair (data feed from Kraken).
- The pair could correct towards the $9,150 or $9,000 support before it starts a fresh rally.
Bitcoin price is showing a lot of bullish signs above $9,000 against the US Dollar. BTC currently traded towards $9,500 and it remains well supported for more gains this week.
Bitcoin Price Analysis
After a minor downside correction, bitcoin price found support near the $9,150 level against the US Dollar. The BTC/USD pair remained well bid and started a fresh increase. It broke the last swing high near $9,392 and traded to a new 2019 high near the $9,473 level. However, the bulls failed to gain strength above $9,500 and the price started another downside correction.
BTC traded below the $9,300 support and the 23.6% Fib retracement level of the recent wave from the $8,830 low to $9,473 high. At the moment, the price is finding support near the $9,250 level. Moreover, there is a key breakout pattern forming with support near $9,220 on the hourly chart of the BTC/USD pair. If the pair breaks the $9,220 support, it could test the $9,150 support.
The 50% Fib retracement level of the recent wave from the $8,830 low to $9,473 high is also near the $9,150 level to act as a strong support. If there are more losses, the price might test the main support near the $9,000 level. An intermediate support is $9,075 and the 61.8% Fib retracement level of the recent wave from the $8,830 low to $9,473 high.
On the upside, an initial resistance is near the $9,320 and $9,350 levels. If the price surpasses the $9,350 level, it is likely to climb back above $9,400. In the mentioned case, the price could even trade to a new 2019 high above the $9,500 level in the near term. The next major hurdles are near $9,550 and $9,650.
Looking at the chart, bitcoin price seems to be struggling near $9,400 and $9,500. Therefore, there are chances of a short term downside correction below $9,250 before a fresh increase. Having said that, the price must stay above the $9,000 handle to avoid any major decline.
Technical indicators:
Hourly MACD – The MACD is slowly gaining momentum in the bearish zone.
Hourly RSI (Relative Strength Index) – The RSI for BTC/USD is currently just near the 50 level.
Major Support Levels – $9,150 followed by $9,000.
Major Resistance Levels – $9,350, $9,400 and $9,500.
The post Bitcoin Trend Overwhelmingly Bullish: Dips In BTC Remain Supported appeared first on NewsBTC.
Source: https://www.newsbtc.com/2019/06/18/bitcoin-trend-overwhelmingly-bullish-btc-supported/

