- ETH price failed to gain momentum above $250 and $252 against the US Dollar.
- The price is currently well below $250 and it remains at a risk of more losses.
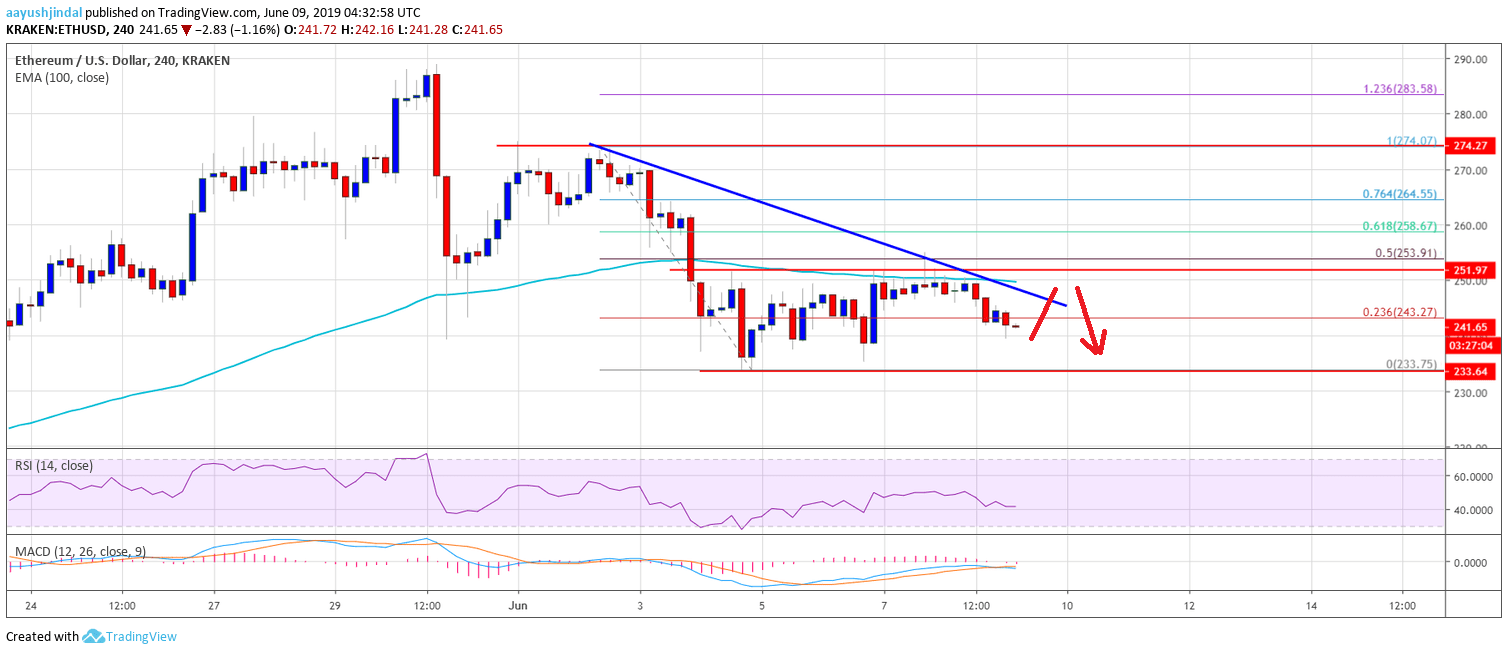
- There is a major bearish trend line forming with resistance at $248 on the 4-hours chart of ETH/USD (data feed via Kraken).
- The pair remains at a risk of more losses and it could accelerate below the $240 level.
Ethereum price is showing signs of weakness versus the US Dollar and bitcoin. ETH is likely to accelerate lower if it breaks the $240 and $235 support levels in the near term.
Ethereum Price Weekly Analysis
This past week, Ethereum price started a short term recovery from the $233 swing low against the US Dollar. The ETH/USD pair recovered above the $240 and $245 levels. There was a break above the 23.6% Fib retracement level of the last decline from the $274 swing high to $233 swing low. However, the price faced a strong resistance near the $250 and $252 resistance levels. Moreover, the 100 simple moving average (4-hours) also prevented gains and acted as a strong resistance.
Moreover, the 50% Fib retracement level of the last decline from the $274 swing high to $233 swing low also stopped upsides. More importantly, there is a major bearish trend line forming with resistance at $248 on the 4-hours chart of ETH/USD. The pair is now trading well below the trend line, $250, and the 100 simple moving average (4-hours). As long as the pair is below $250, it remains at a risk of more losses. An initial support is near the $240 level, below which the price could retest the $235 support.
If there are more losses, the price could decline sharply towards the $225 support. To start a decent recovery, the price must surpass the trend line, $250, and the 100 simple moving average (4-hours). A successful close above $250 could initiate a strong upward move towards the $255 and $260 levels. The next key resistance for the bulls is near the $270 level.
The above chart indicates that Ethereum price is facing a strong resistance near the $250 level and the 100 SMA. If the bulls continue to struggle, the price is likely to accelerate lower towards the $225 and $220 levels. On the upside, a clear break above $250 and $252 might start a strong upward move in the near term.
Technical Indicators
4 hours MACD – The MACD for ETH/USD is slowly moving in the bearish zone.
4 hours RSI – The RSI for ETH/USD is currently well below the 50 level and it could decline further below 40.
Major Support Level – $235
Major Resistance Level – $250
The post Ethereum (ETH) Price Weekly Forecast: More Downsides Likely appeared first on NewsBTC.
Source: https://www.newsbtc.com/2019/06/09/ethereum-eth-price-weekly-forecast-more-downsides-likely/

