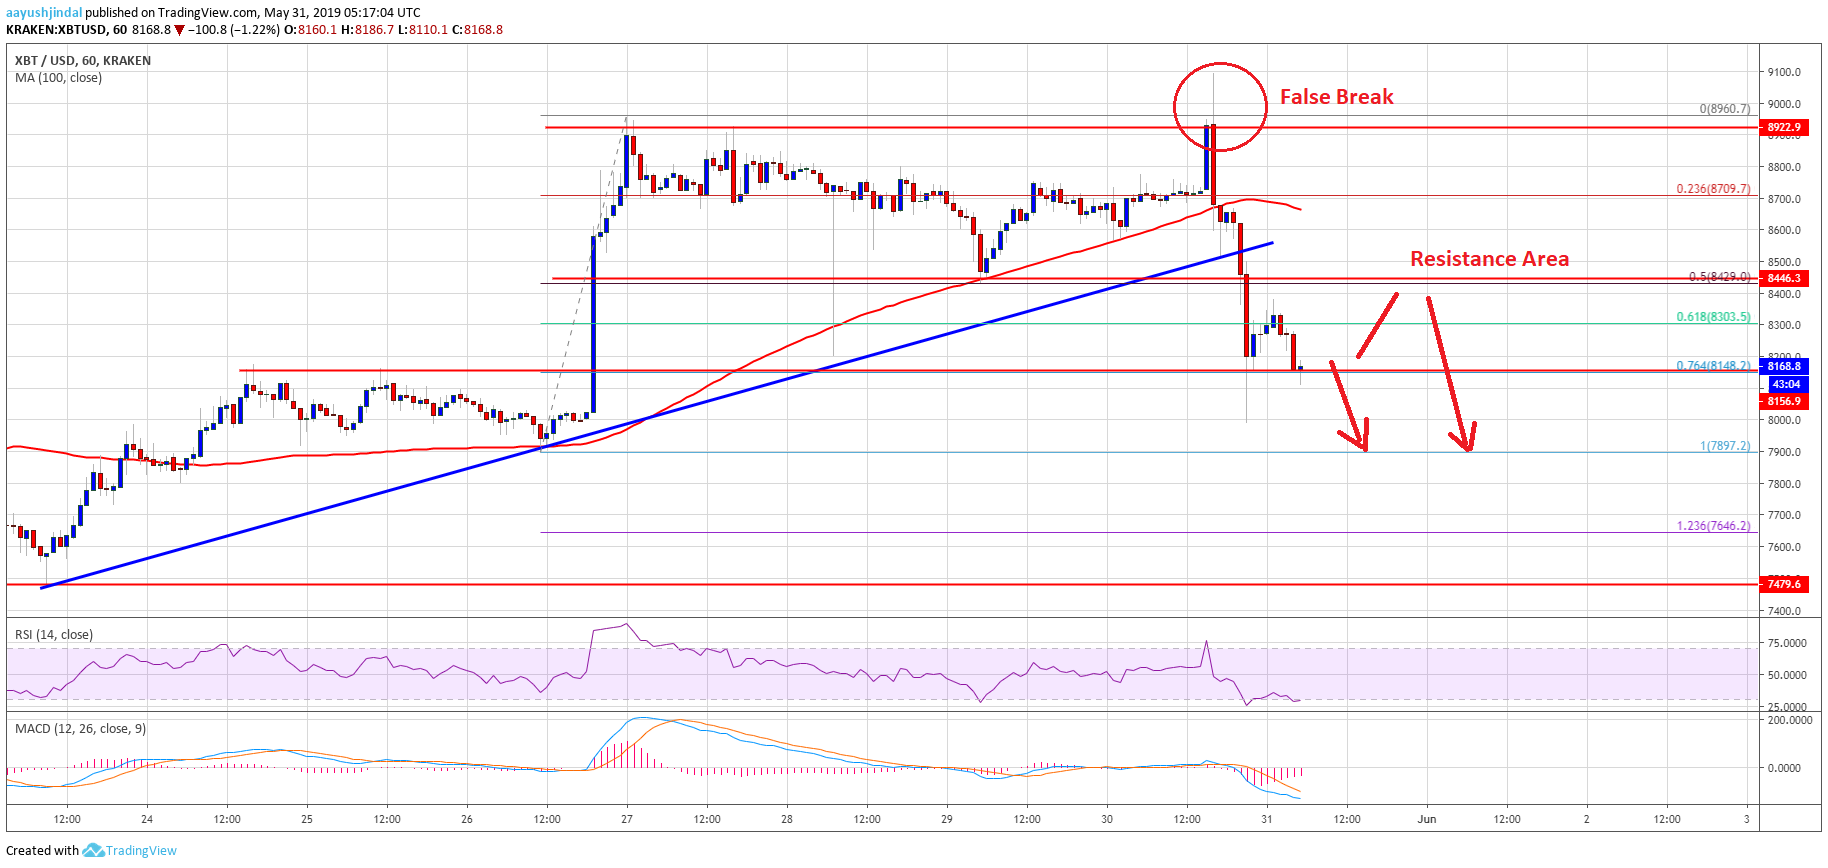
- Bitcoin price spiked above the $8,950 and $9,000 levels, but failed to hold gains against the US Dollar.
- The price declined heavily and traded below the $8,720 and $8,440 support levels.
- There was a break below a crucial bullish trend line with support at $8,560 on the hourly chart of the BTC/USD pair (data feed from Kraken).
- The pair is currently trading in a bearish zone below the $8,300 level and it could continue lower.
Bitcoin price failed near the $9,000 level and declined sharply against the US Dollar. BTC is currently trading in a bearish zone, with a risk of a drop towards the $7,880 support.
Bitcoin Price Analysis
Yesterday, there was an upside extension in bitcoin price above $8,800 against the US Dollar. The BTC/USD pair spiked above the $8,950 and $9,000 levels, but failed to hold gains. As a result, there was a major bearish reaction below the $8,800 level. The price declined heavily below the $8,600 support level and the 100 hourly simple moving average. Moreover, there was a clear break below the 50% Fib retracement level of the upward move from the $7,897 low to $8,960 swing high.
More importantly, there was a break below a crucial bullish trend line with support at $8,560 on the hourly chart of the BTC/USD pair. The pair is currently trading below the $8,200 level and recently tested the 76.4% Fib retracement level of the upward move from the $7,897 low to $8,960 swing high. If there is an upside correction, an initial resistance could be near the $8,400 level. The main resistance might be $8,440, above which the price could revisit the $8,700 level.
On the downside, an immediate support is at $8,000. If there is break below $8,000, the price could retest the $7,880 support area. If there are more losses, the next target for the bulls might be $7,646. It represents the 1.236 Fib extension level of the upward move from the $7,897 low to $8,960 swing high. The current price action is bearish and there is a risk of more losses below $8,000.
Looking at the chart, bitcoin price clearly started a major downside correction below $8,500. There could be range moves in the short term, but the price is likely to extend downsides below $8,100. Once the current correction is complete near $7,880 or $7,646, the price is likely to bounce back.
Technical indicators:
Hourly MACD – The MACD is slowly reducing its bearish slope, with no major positive sign.
Hourly RSI (Relative Strength Index) – The RSI for BTC/USD declined heavily and it is currently flat in the oversold zone.
Major Support Levels – $8,000 followed by $7,880.
Major Resistance Levels – $8,300, $8,440 and $8,500.
The post Bitcoin (BTC) Price Nosedives: Is This The Start Of Major Correction? appeared first on NewsBTC.

