- Bitcoin price extended gains above the $6,400 and $6,440 resistance levels against the US Dollar.
- The price tested the key $6,500 resistance level as discussed in yesterday’s analysis.
- Besides, yesterday’s highlighted important bullish trend line is intact with support at $6,060 on the hourly chart of the BTC/USD pair (data feed from Kraken).
- The pair remains in a strong uptrend and it seems like the real test for the bulls could be near $6,850.
Bitcoin price is extending its rally above the $6,450 level against the US Dollar. BTC is following a solid bullish path and it seems like it could even test the $6,800 level in the near term.
Bitcoin Price Analysis
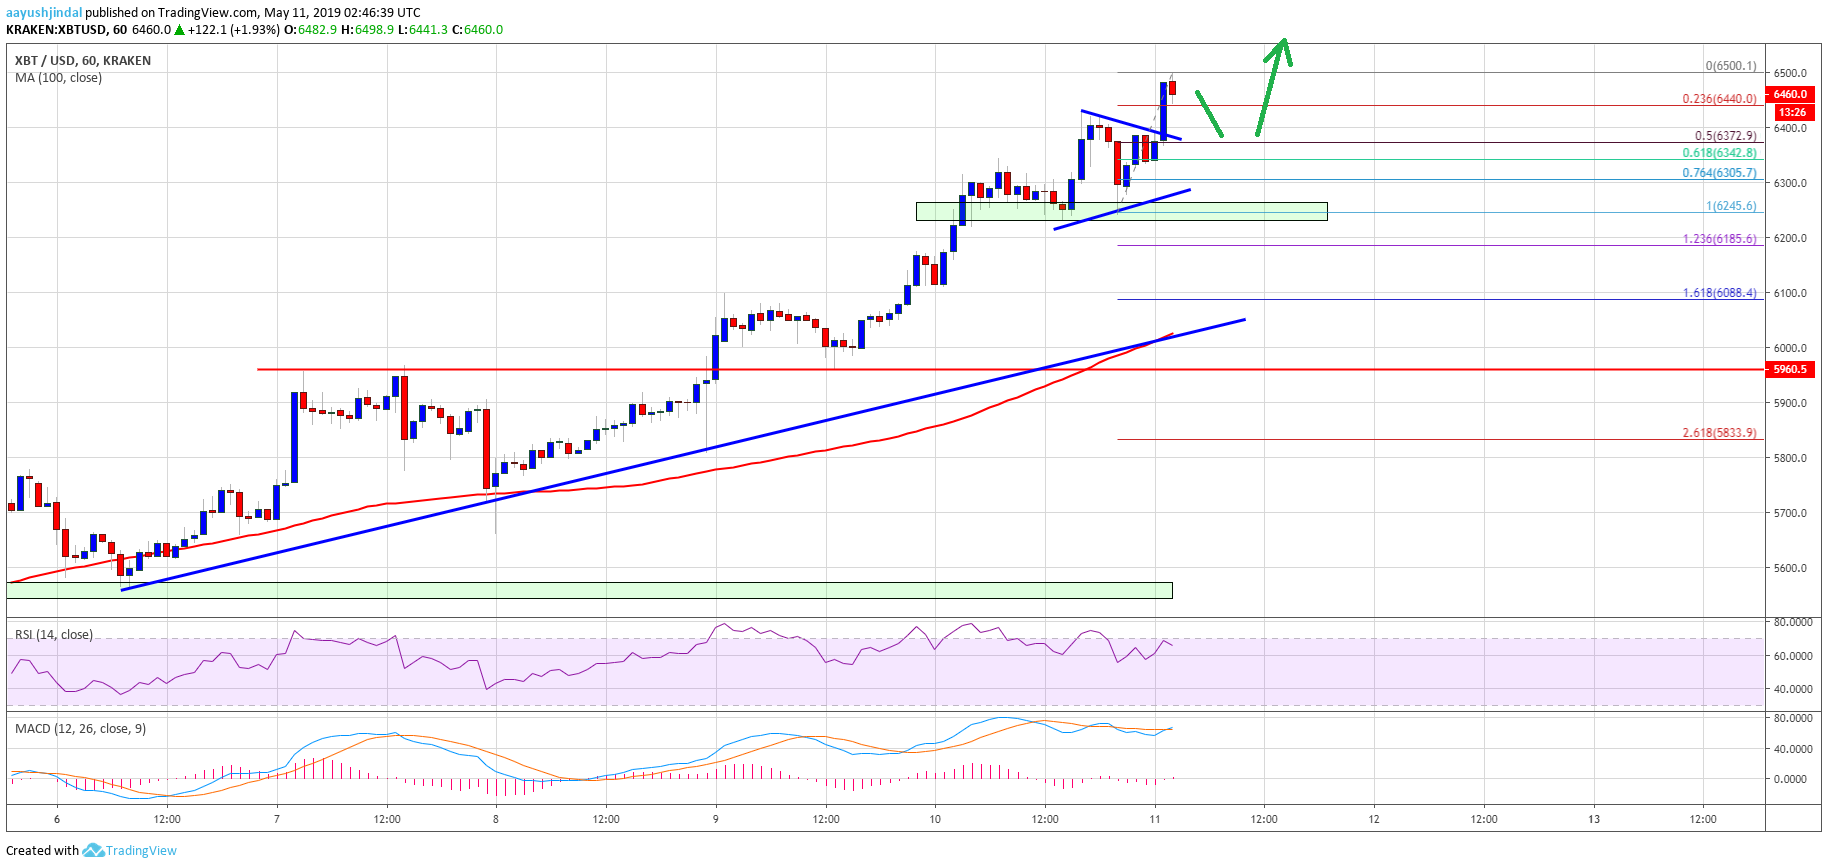
Yesterday, we saw a strong rise in bitcoin price above the $6,200 resistance area against the US Dollar. The BTC/USD pair even broke the $6,350 level and settled well above the 100 hourly simple moving average. As a result, the bulls are in control and they were successful in clearing a major resistance area near the $6,400 level. Earlier, there was a minor dip, but the $6,280 and $6,300 levels provided support. As a result, the price bounced back and broke the $6,450 level.
It recently tested the $6,500 level and is currently consolidating gains. An initial support is near $6,440, and the 23.6% Fib retracement level of the recent wave from the $6,245 low to $6,500 high. However, the main support is near the previous breakout zone at $6,400. Besides, the 50% Fib retracement level of the recent wave from the $6,245 low to $6,500 high is also near the $6,400 level to act as a strong support. Below $6,400, the price may decline back towards the $6,250 support area.
More importantly, yesterday’s highlighted important bullish trend line is intact with support at $6,060 on the hourly chart of the BTC/USD pair. The pair is clearly in a strong uptrend and it seems like it could even break the $6,550 and $6,600 levels in the coming sessions. As a result, the main target for the bulls could near the $6,800 and $6,850 levels (as pointed out in one of the previous analysis with the daily chart).

Looking at the chart, bitcoin price is gaining traction above the $6,400 level. There may be a couple of swing moves towards $6,400 or $6,300, but dips remain well supported. Only a close below the $6,000 pivot level and the 100 hourly SMA could start a strong correction.
Technical indicators:
Hourly MACD – The MACD is about to gain momentum in the bullish zone, with bullish signs.
Hourly RSI (Relative Strength Index) – The RSI for BTC/USD is moving higher towards the 75 level.
Major Support Levels – $6,400 followed by $6,250.
Major Resistance Levels – $6,500, $6,600 and $6,800.
The post Bitcoin (BTC) Price Hits $6.5K Target: $6.85K Could Be The Real Test appeared first on NewsBTC.
Source: https://www.newsbtc.com/2019/05/11/bitcoin-btc-price-hits-6-5k-real-test-ahead/
